Analysis: company 🇸🇬
Reported median total compensation among Singapore survey respondents, grouped by company type, industry, company size, design team size, headquarters location, work arrangement, and weekly extra hours.
Analysis: company 🇸🇬
Company type
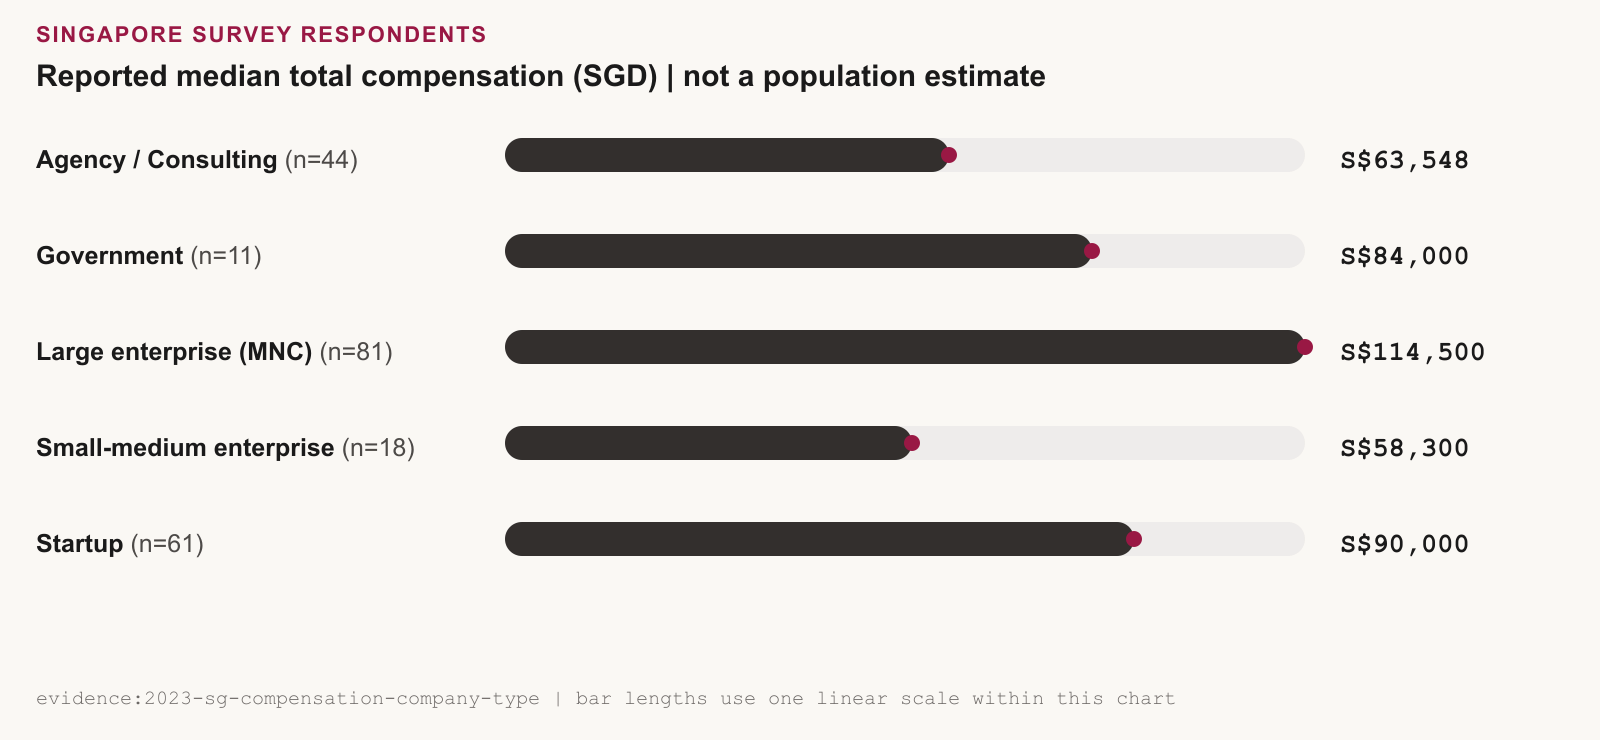
Reported median total compensation nearly doubles across the range, from Small-medium enterprise respondents at S$58,300 to Large enterprise respondents at S$114,500. Company types with fewer than 10 respondents are omitted.
The figures describe the people who answered the survey. Respondent mix varies across company types, and the comparison is unadjusted.
Chart proof
Median total compensation by company type
Reported median total compensation in SGD among Singapore survey respondents in each published company-type subgroup. These survey medians are not population estimates. Subgroups below n=10 are suppressed.
Among published company-type subgroups in the Singapore survey, reported median total compensation ranged from S$58,300 for Small-medium enterprise respondents to S$114,500 for Large enterprise respondents. These are survey medians, not population estimates.
View data table
| Subgroup among Singapore survey respondents (n) | Reported median total compensation (SGD), not a population estimate |
|---|---|
| Agency / Consulting (n=44) | S$63,548 |
| Government (n=11) | S$84,000 |
| Large enterprise (MNC) (n=81) | S$114,500 |
| Small-medium enterprise (n=18) | S$58,300 |
| Startup (n=61) | S$90,000 |
Industry
Among industries with at least 10 respondents, the published ranking runs high to low:
- Retail, Wholesale & Distribution
- Investment Management
- Consumer Products
- Banking & Capital Markets (the largest cohort, n=43)
- Transportation, Hospitality & Services
- Health Care
The figures describe the people who answered the survey. Respondent mix varies across industries, and the comparison is unadjusted.
Chart proof
Median total compensation by industry
Reported median total compensation in SGD among Singapore survey respondents in each published industry subgroup with at least 10 respondents. These survey medians are not population estimates. Subgroups below n=10, and unspecified industry responses, are suppressed.
Among industry subgroups with at least 10 Singapore survey respondents, reported median total compensation ranged from S$71,000 for Health Care respondents to S$125,600 for Retail, Wholesale & Distribution respondents. These are survey medians, not population estimates.
View data table
| Subgroup among Singapore survey respondents (n) | Reported median total compensation (SGD), not a population estimate |
|---|---|
| Banking & Capital Markets (n=43) | S$85,000 |
| Consumer Products (n=43) | S$99,000 |
| Government & Public Services (n=18) | S$72,075 |
| Health Care (n=10) | S$71,000 |
| Investment Management (n=11) | S$91,545 |
| Retail, Wholesale & Distribution (n=11) | S$125,600 |
| Transportation, Hospitality & Services (n=20) | S$90,000 |
Company size
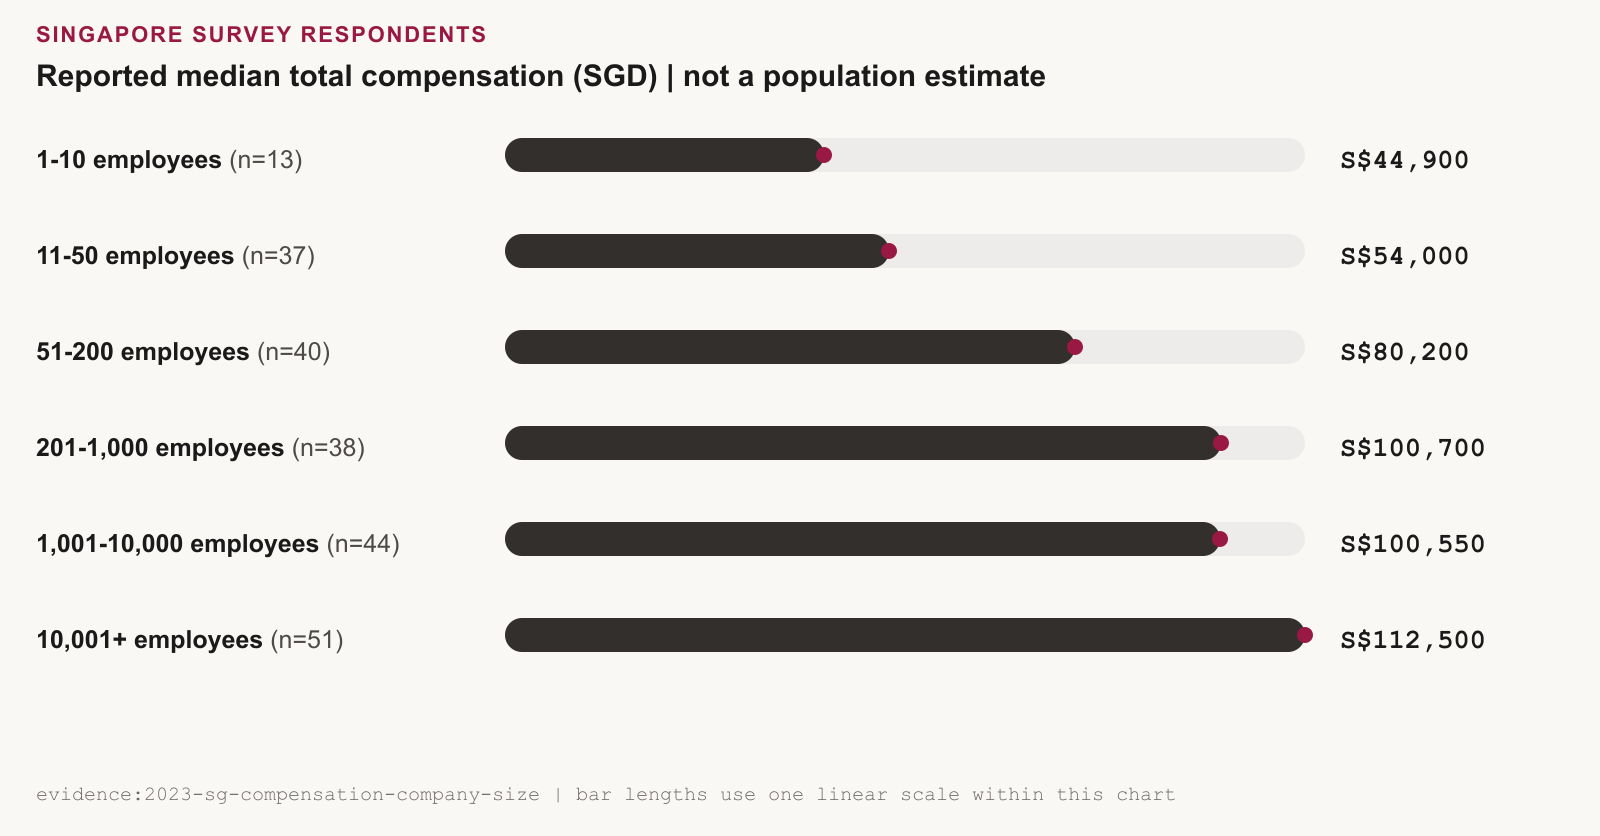
Reported medians range from S$44,900 at companies with 1–10 employees to S$112,500 at companies with 10,001 or more. The steepest step sits between the 51–200 and 201–1,000 employee bands, a 25.5% jump in reported median pay.
Respondent mix may differ across company-size groups. Read these figures as survey descriptions rather than expected pay at a given company.
Chart proof
Median total compensation by company size
Reported median total compensation in SGD among Singapore survey respondents in each company-size subgroup. These survey medians are not population estimates.
Reported median total compensation among Singapore survey respondents rises steadily with company size, from S$44,900 at the smallest firms to S$112,500 at the largest. These are survey medians, not population estimates.
View data table
| Subgroup among Singapore survey respondents (n) | Reported median total compensation (SGD), not a population estimate |
|---|---|
| 1–10 employees (n=13) | S$44,900 |
| 11–50 employees (n=37) | S$54,000 |
| 51–200 employees (n=40) | S$80,200 |
| 201–1,000 employees (n=38) | S$100,700 |
| 1,001–10,000 employees (n=44) | S$100,550 |
| 10,001+ employees (n=51) | S$112,500 |
Design team size
Reported medians rise with design team size:
- Solo designers: S$50,150
- Teams of 2 to 10 (n=115): S$78,000
- Teams of 11 to 50: S$108,002
- Teams of 51 to 200: S$106,600
- Teams of 200 or more: S$174,300
Respondent counts for team sizes other than 2 to 10 are not disclosed in the source data, so treat these bands as descriptive, not cohort-verified.
Headquarters location
Respondents not physically based at their company's headquarters recorded a median of S$120,280, against S$72,000 for respondents at headquarters, 67.1% more. Role, seniority, and employer type may matter as much as location itself, so this is an unadjusted comparison.
Chart proof
Median total compensation by headquarters location
Reported median total compensation in SGD among Singapore survey respondents, grouped by whether they work physically at their company's headquarters. These survey medians are not population estimates.
Reported median total compensation among Singapore survey respondents was S$72,000 for respondents physically at their company's headquarters, compared with S$120,280 for respondents not at headquarters. These are survey medians, not population estimates.
View data table
| Subgroup among Singapore survey respondents (n) | Reported median total compensation (SGD), not a population estimate |
|---|---|
| At headquarters (n=139) | S$72,000 |
| Not at headquarters (n=66) | S$120,280 |
Work arrangement
Remote respondents recorded a median of S$143,336, roughly 2.7 times the In-office median and 1.8 times the Hybrid median. Role, seniority, employer, and other characteristics may differ across these groups, so this is an unadjusted comparison.
Chart proof
Median total compensation by work arrangement
Reported median total compensation in SGD among Singapore survey respondents, grouped by work arrangement. These survey medians are not population estimates.
Reported median total compensation among Singapore survey respondents was S$81,900 for Hybrid, S$52,000 for In-office, and S$143,336 for Remote. These are survey medians, not population estimates.
View data table
| Subgroup among Singapore survey respondents (n) | Reported median total compensation (SGD), not a population estimate |
|---|---|
| Hybrid (n=179) | S$81,900 |
| In-office (n=21) | S$52,000 |
| Remote (n=23) | S$143,336 |
Working hours
The published report's only seniority-linked claim here is that directors and VPs work the longest hours on average of any seniority level; the report did not publish an hours-by-seniority breakdown we can independently verify, so this stays as the report's own hedged observation rather than a site-verified figure.
Reported median total compensation does rise with self-reported extra hours worked per week, though the source report did not publish respondent counts for each band, so read these medians as descriptive rather than cohort-verified.
Chart proof
Median total compensation by weekly extra hours
Reported median total compensation in SGD among Singapore survey respondents, grouped by self-reported extra hours worked per week beyond contracted hours. The source report did not publish respondent counts for each band; these are survey medians for the Singapore SGD cohort (n=223), not population estimates.
Among Singapore survey respondents, reported median total compensation was highest for those working 5 or more extra hours a week, at S$110,632.50. Respondent counts for each band were not published in the source report; these are survey medians, not population estimates.
View data table
| Self-reported extra hours per week (Singapore SGD cohort, n=223) | Reported median total compensation (SGD), not a population estimate |
|---|---|
| 0 hours | S$78,650 |
| 1–2 hours | S$78,425 |
| 3–5 hours | S$83,200 |
| 5+ hours | S$110,632.50 |
Extra hours and higher pay may both simply track seniority.
Source: Design Pay Asia 2022-23 survey data. Filtered to Singapore respondents paid in SGD (n=223).
Some cohorts here are too small to publish without identifying individuals, so we hold those figures back.
Where this sits in the conversation
-
Overview
2023 report -
Landscape
Demographics -
Landscape
Roles and experience -
Landscape
Compensation -
Landscape
Company landscape -
Sentiments
Sentiments: negotiations and pay -
Sentiments
Sentiments: work setup -
Sentiments
Sentiments: career progression -
Singapore deep dive
Analysis: gender 🇸🇬 -
Singapore deep dive
Analysis: experience 🇸🇬 -
Singapore deep dive
Analysis: company 🇸🇬 you are here -
Singapore deep dive
Analysis: education 🇸🇬 -
Close
The first count