Analysis: gender 🇸🇬
Reported median total compensation for the gender cohorts among Singapore survey respondents that meet the publication threshold, including a per-level pay gap breakdown and the experience mix behind the headline figure.
Analysis: gender 🇸🇬
Reported medians by gender
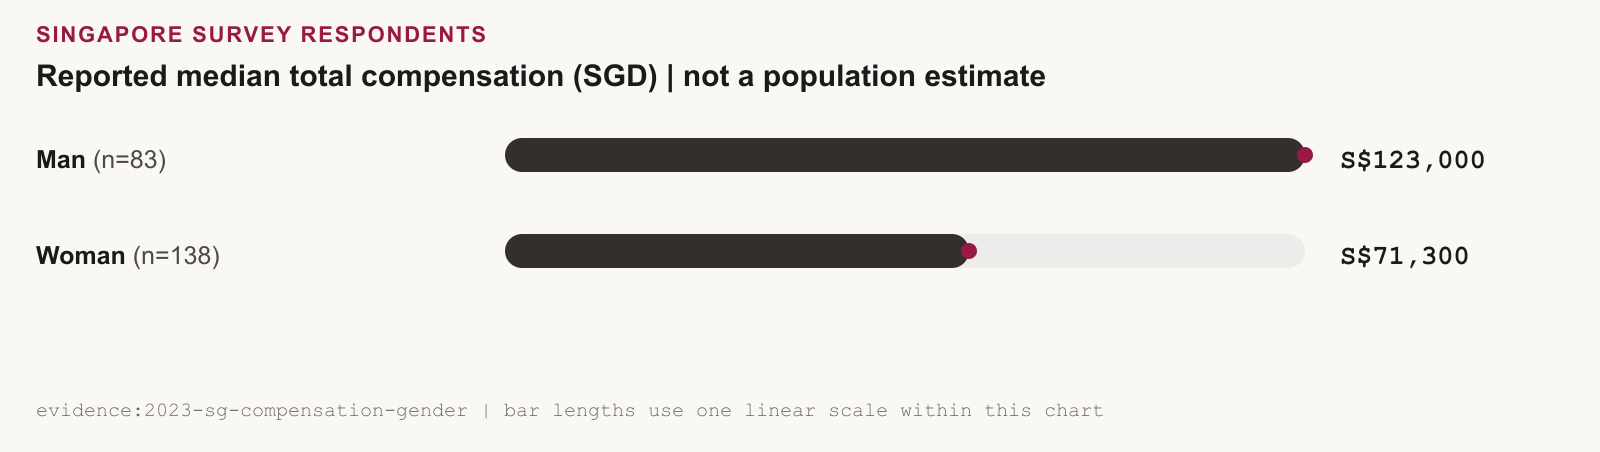
Man respondents recorded median total compensation of S$123,000. Woman respondents recorded S$71,300, a 42% gap between the two published cohorts' raw medians. Other gender responses are omitted because each cohort falls below the publication threshold.
This is a cross-sectional, unadjusted comparison of two respondent cohorts, not a population-wide estimate or a matched-role analysis.
Chart proof
Median total compensation by gender
Reported median total compensation in SGD for the published gender cohorts among Singapore survey respondents. These survey medians are not population estimates. Cohorts below n=10 are suppressed.
Among published gender cohorts in the Singapore survey, Man respondents reported median total compensation of S$123,000 and Woman respondents reported S$71,300. These are survey medians, not population estimates. Other gender cohorts are suppressed because they contain fewer than 10 respondents.
View data table
| Subgroup among Singapore survey respondents (n) | Reported median total compensation (SGD), not a population estimate |
|---|---|
| Man (n=83) | S$123,000 |
| Woman (n=138) | S$71,300 |
What the headline gap is made of
Much of that 42% reflects who is in each cohort, not unequal pay for the same work. Woman respondents in the Singapore cohort had a median of 3 years of design experience, against 7 years for Man respondents. Women in this survey are, on average, earlier in their careers, and career stage is one of the strongest predictors of pay in this dataset (see the experience analysis). The per-level breakdown below strips out most of that seniority mix, and it's the closer like-for-like read on the gap.
Pay gap by seniority level
Comparing medians within each seniority level, restricted to levels where both genders published, sharpens the picture. At Junior IC, men earned 11.85% less than women. From Mid-level IC upward the direction reverses:
- Mid-level IC: women earned 11.32% less than men
- Senior IC: women earned 21.1% less than men
- People Manager: women earned 21.22% less than men
Of the two levels with a gap above 20%, Senior IC has the larger combined cohort (n=52, against n=23 at People Manager), so its 21.1% gap is the more reliable reading of the two.
Lead/Staff/Principal IC and Director levels aren't shown here. The Lead/Staff woman cohort (n=7) falls short of the publication threshold, and there's too little data at the Director level to say anything reliable about it.
Chart proof
Median pay by level and gender
Reported median total compensation by gender at each Singapore survey seniority level where both gender cohorts meet the n=10 publication threshold. Grouped bars show each gender's median side by side at each level. Lead/Staff/Principal IC and Director levels are omitted because at least one gender cohort in each falls below n=10.
Among Singapore survey seniority levels where both gender cohorts published, the gap reverses above Junior IC: men earn less at Junior IC, then women earn less from Mid-level IC upward, most pronounced at Senior IC and People Manager. These are gaps between survey medians, not population estimates or matched-role comparisons.
View data table
| Seniority level | Men median (S$) | Men n | Women median (S$) | Women n |
|---|---|---|---|---|
| Junior IC | 47,600 | 10 | 54,000 | 53 |
| Mid-level IC | 83,900 | 20 | 74,400 | 35 |
| Senior IC | 133,150 | 20 | 105,050 | 32 |
| People Manager | 151,380 | 13 | 119,250 | 10 |
Negotiation and levelling
Men negotiated their current compensation more often than women, 61% against 51%, and reported more formal levelling progress over the past year, 62% against 52%. Both gaps sit alongside the per-level pay differences above, though this survey can't establish how much either behaviour contributes to outcomes.
Pay rises
Reported pay rises were broadly similar by gender across all six brackets (Men n=83, Women n=138). In the top bracket, more than 20%, 24.4% of men and 25.2% of women reported an increase: women's share was marginally higher. Rates of no increase at all were also close: 19.5% of men against 20.6% of women. Whatever is driving the per-level gaps above, it isn't a starkly unequal spread of rise sizes.
Chart proof
Pay-rise distribution by gender
Share of each gender cohort among Singapore survey respondents reporting a pay rise in each bracket over the past year. Men (n=83) and Women (n=138) are each read as a share of their own cohort, not a share of all respondents.
Reported pay-rise shares for Singapore survey respondents (Men n=83, Women n=138) track closely by gender across all six brackets, including the no-increase and top brackets.
View data table
| Pay-rise bracket, gender (n) | Share of cohort reporting this rise |
|---|---|
| No increase, Men (n=83) | 19.5% |
| No increase, Women (n=138) | 20.6% |
| 0.1–5%, Men (n=83) | 19.5% |
| 0.1–5%, Women (n=138) | 18.3% |
| 6–10%, Men (n=83) | 15.9% |
| 6–10%, Women (n=138) | 16.0% |
| 11–15%, Men (n=83) | 12.2% |
| 11–15%, Women (n=138) | 9.9% |
| 16–20%, Men (n=83) | 8.5% |
| 16–20%, Women (n=138) | 9.9% |
| More than 20%, Men (n=83) | 24.4% |
| More than 20%, Women (n=138) | 25.2% |
Sentiment by gender
The published report also compares sentiment by gender, covering things like perceived fairness of pay and job-search intent. That chart wasn't numerically labelled in the published report, so we don't reproduce specific figures here.
Source: Design Pay Asia 2022-23 survey data. Filtered to Singapore respondents paid in SGD (n=223).
Some cohorts here are too small to publish without identifying individuals, so we hold those figures back.
Where this sits in the conversation
-
Overview
2023 report -
Landscape
Demographics -
Landscape
Roles and experience -
Landscape
Compensation -
Landscape
Company landscape -
Sentiments
Sentiments: negotiations and pay -
Sentiments
Sentiments: work setup -
Sentiments
Sentiments: career progression -
Singapore deep dive
Analysis: gender 🇸🇬 you are here -
Singapore deep dive
Analysis: experience 🇸🇬 -
Singapore deep dive
Analysis: company 🇸🇬 -
Singapore deep dive
Analysis: education 🇸🇬 -
Close
The first count