Analysis: experience 🇸🇬
Reported median total compensation among Singapore survey respondents, grouped by seniority, years of design experience, international work experience, and negotiation response.
Analysis: experience 🇸🇬
Seniority
Median compensation rises from Junior through Senior IC, dips at Lead/Staff/Principal IC, then rises again for People Manager — the ranges overlap more than the medians alone suggest. Senior ICs report both the widest spread of any cohort here and the highest single figure in the section, stretching further than either Lead/Staff/Principal IC or People Manager pay.
These are cross-sectional groups with different roles and respondent profiles, not an individual salary path. Director and Vice President responses are omitted because those cohorts fall below the publication threshold.
Chart proof
Pay range by seniority
Reported minimum, median, and maximum total compensation in SGD among Singapore survey respondents in each published seniority subgroup. These are survey figures, not population estimates. Subgroups below n=10 are suppressed.
Among the published Singapore survey subgroups, reported total compensation and its spread both climb with seniority, with Senior IC respondents reporting the widest range and the highest single figure. These are survey figures, not population estimates.
View data table
| Subgroup among Singapore survey respondents | n | Minimum (S$) | Median (S$) | Maximum (S$) |
|---|---|---|---|---|
| Junior IC | 63 | 12,000 | 54,000 | 157,000 |
| Mid-level IC | 56 | 34,800 | 75,800 | 210,000 |
| Senior IC | 52 | 44,200 | 119,500 | 339,927 |
| Lead / Staff / Principal IC | 19 | 38,400 | 103,200 | 201,342 |
| People Manager | 23 | 37,396 | 139,100 | 235,000 |
Years of design experience
Median total compensation rises steadily with years of design experience, gaining an average of S$10,839 for every additional year across the whole sample. That figure is the annualised slope behind the trend, not a promise of an automatic yearly rise for any individual respondent.
The reported range widens alongside the median too. Respondents with 10 or more years of design experience report the widest spread of any band in this section, from S$52,000 to S$355,000.
Chart proof
Pay range by years of design experience
Reported minimum, median, and maximum total compensation in SGD among Singapore survey respondents, grouped by years of design experience (YOE). These are survey figures, not population estimates.
Among Singapore survey respondents, reported total compensation and its range both increase with years of design experience, with the widest spread reported for those with 10 or more years, from S$52,000 to S$355,000. These are survey figures, not population estimates.
Widest range: S$52,000–S$355,000
View data table
| Years of design experience | n | Minimum (S$) | Median (S$) | Maximum (S$) |
|---|---|---|---|---|
| 0–3 years | 98 | 12,000 | 62,700 | 230,636 |
| 4–6 years | 55 | 35,100 | 96,000 | 230,000 |
| 7–9 years | 38 | 48,000 | 131,650 | 208,000 |
| 10+ years | 32 | 52,000 | 156,100 | 355,000 |
International work experience
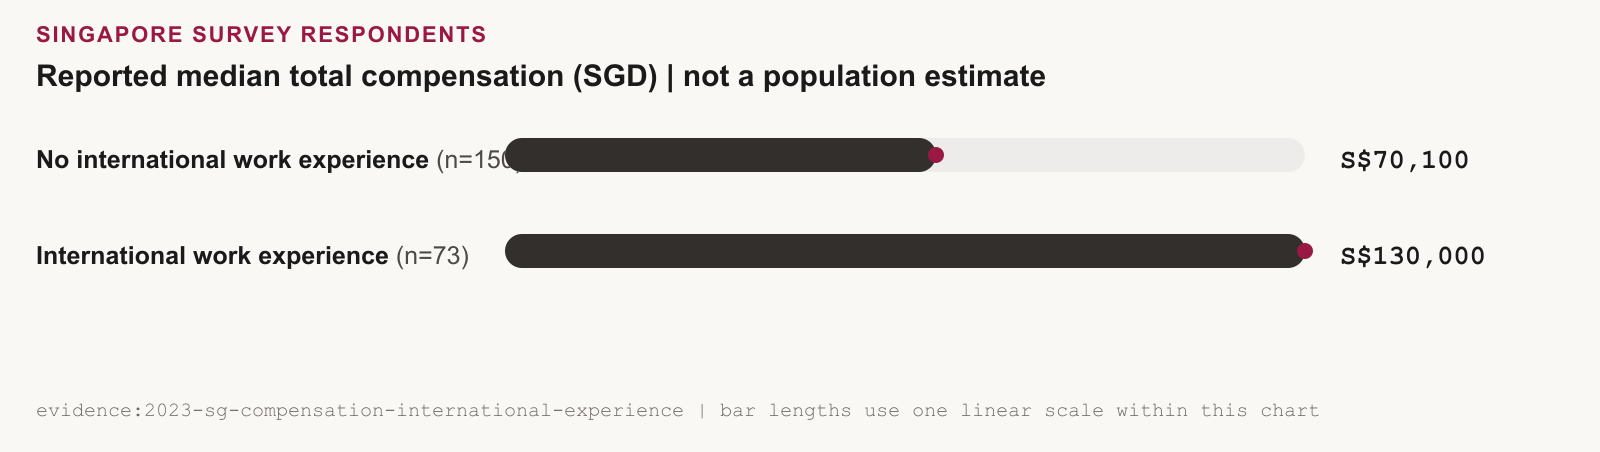
Respondents who reported international work experience had a median of S$130,000, 85.5% higher than the S$70,100 median among respondents who did not. Part of that gap is experience mix rather than international exposure alone: respondents with international work experience averaged 7.1 years of design experience, against 4.4 years for those without it. This is an unadjusted comparison; seniority, role, company, and other respondent characteristics may also differ between the groups.
Chart proof
Median total compensation by international work experience
Reported median total compensation in SGD among Singapore survey respondents, grouped by whether they reported international work experience. These survey medians are not population estimates.
Singapore survey respondents who reported no international work experience had median total compensation of S$70,100, while respondents who reported international work experience had a median of S$130,000. These are survey medians, not population estimates.
View data table
| Subgroup among Singapore survey respondents (n) | Reported median total compensation (SGD), not a population estimate |
|---|---|
| No international work experience (n=150) | S$70,100 |
| International work experience (n=73) | S$130,000 |
Current-compensation negotiation
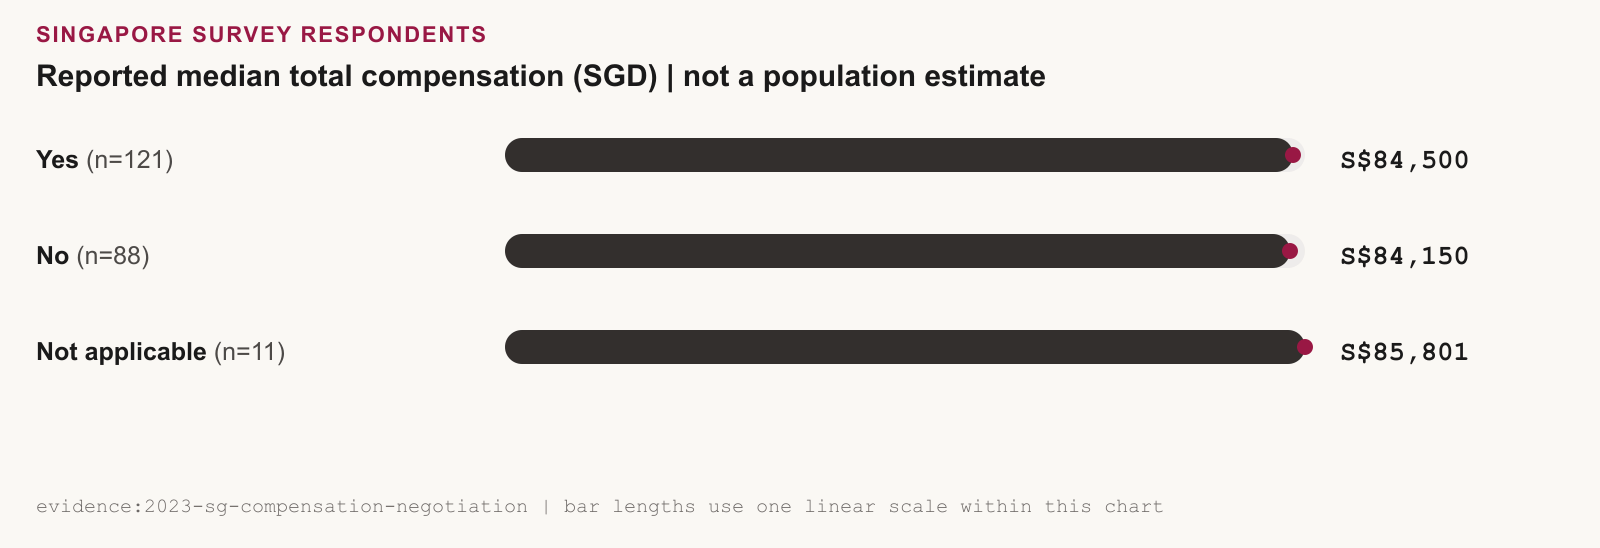
The three published negotiation-response groups land within roughly 2% of one another. On the whole sample, whether someone negotiated their current pay shows next to no relationship with what they ended up earning. Blank responses are omitted, and this is an unadjusted comparison of survey groups.
Chart proof
Median total compensation by salary negotiation
Reported median total compensation in SGD among Singapore survey respondents, grouped by their answer about negotiating current compensation. These survey medians are not population estimates. Blank responses are omitted.
Reported median total compensation among Singapore survey respondents was S$84,500 for Yes responses, S$84,150 for No responses, and S$85,801 for Not applicable responses. These are survey medians, not population estimates, and blank responses are omitted.
View data table
| Subgroup among Singapore survey respondents (n) | Reported median total compensation (SGD), not a population estimate |
|---|---|
| Yes (n=121) | S$84,500 |
| No (n=88) | S$84,150 |
| Not applicable (n=11) | S$85,801 |
By years of design experience
That aggregate is nearly flat, but it masks a split by career stage. Below 7 years of design experience, respondents who negotiated reported lower medians than those who did not. From 7 years onward, the pattern reverses, and negotiators report medians roughly 11–22% higher than non-negotiators in the two most senior bands.
Read the early-career figures cautiously. This is a cross-sectional snapshot, not a study of individual outcomes, and selection effects cut both ways. Someone earning less may be more likely to negotiate in the first place, and a small gap at entry level is easily overstated. The impact of negotiating seems more pronounced for respondents with 7 or more years of design experience; it isn't a clean story below that.
Chart proof
Median total compensation by negotiation and years of design experience
Reported median total compensation in SGD among Singapore survey respondents who negotiated their current compensation versus those who did not, grouped by years of design experience (YOE). These survey medians are not population estimates. Per-cell sample sizes for this breakdown are not separately published; only the YOE-band totals shown in the years-of-experience chart above are reported.
Among Singapore survey respondents grouped by years of design experience, negotiators reported lower medians than non-negotiators before 7 years of experience, and higher medians from 7 years onward.
View data table
| Years of design experience, negotiation response | Reported median total compensation (SGD), not a population estimate |
|---|---|
| 0–3 years, negotiated | S$56,275 |
| 0–3 years, did not negotiate | S$65,100 |
| 4–6 years, negotiated | S$72,000 |
| 4–6 years, did not negotiate | S$106,600 |
| 7–9 years, negotiated | S$137,500 |
| 7–9 years, did not negotiate | S$112,800 |
| 10+ years, negotiated | S$159,000 |
| 10+ years, did not negotiate | S$143,500 |
Source: Design Pay Asia 2022-23 survey data. Filtered to Singapore respondents paid in SGD (n=223).
Some cohorts here are too small to publish without identifying individuals, so we hold those figures back.
Where this sits in the conversation
-
Overview
2023 report -
Landscape
Demographics -
Landscape
Roles and experience -
Landscape
Compensation -
Landscape
Company landscape -
Sentiments
Sentiments: negotiations and pay -
Sentiments
Sentiments: work setup -
Sentiments
Sentiments: career progression -
Singapore deep dive
Analysis: gender 🇸🇬 -
Singapore deep dive
Analysis: experience 🇸🇬 you are here -
Singapore deep dive
Analysis: company 🇸🇬 -
Singapore deep dive
Analysis: education 🇸🇬 -
Close
The first count