Roles & experiences
Employment types, design functions, and career levels of respondents.
Roles & experiences
Full-time employment remains the default shape of a design career in the region, though a meaningful minority build one through freelance or contract work instead. Product and UX design sit at the centre of what "designer" means here, and the roles clustered around them show how far the label now stretches.
Chart proof
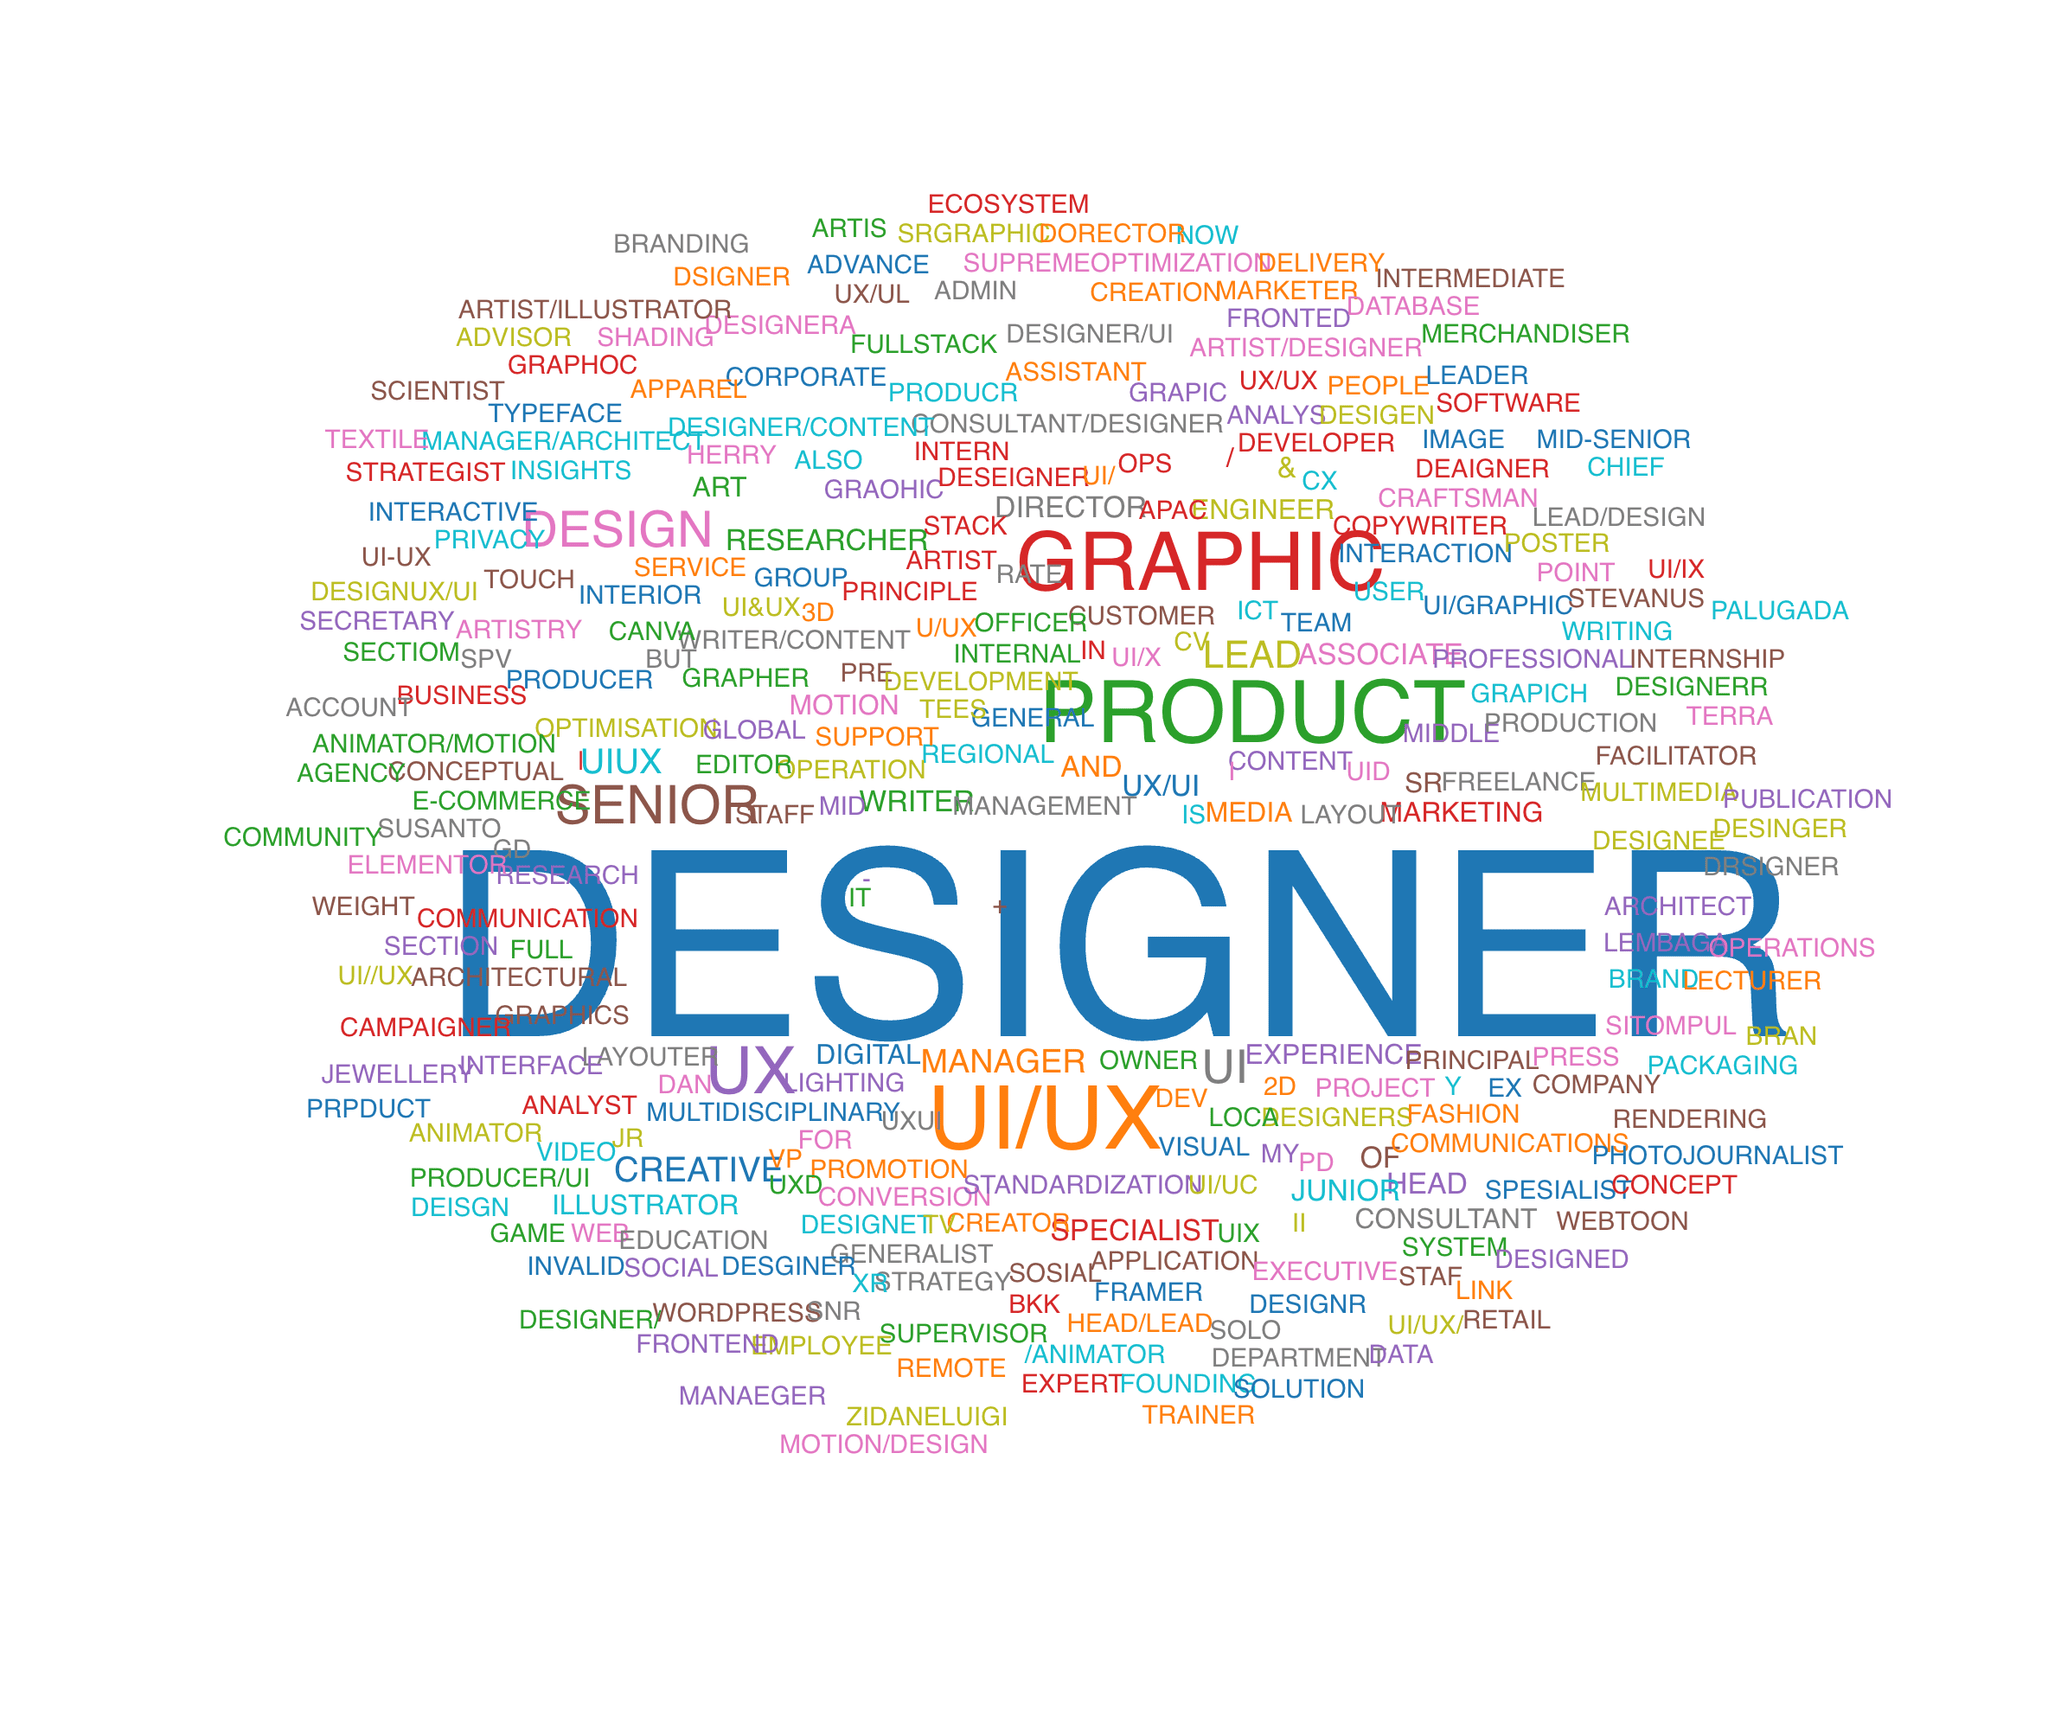
Job titles word cloud
Word cloud of job titles across all respondents, illustrating role diversity.
Designer remains the core identity; Product/UX roles dominate alongside Creative and Leadership titles (Lead, Manager, Director).
View data table
| Role cluster | Notes |
|---|---|
| Designer (central) | Most common term |
| Product/UX design | Primary specialisations |
| Leadership (Lead, Manager, Director) | Significant presence |
Chart proof
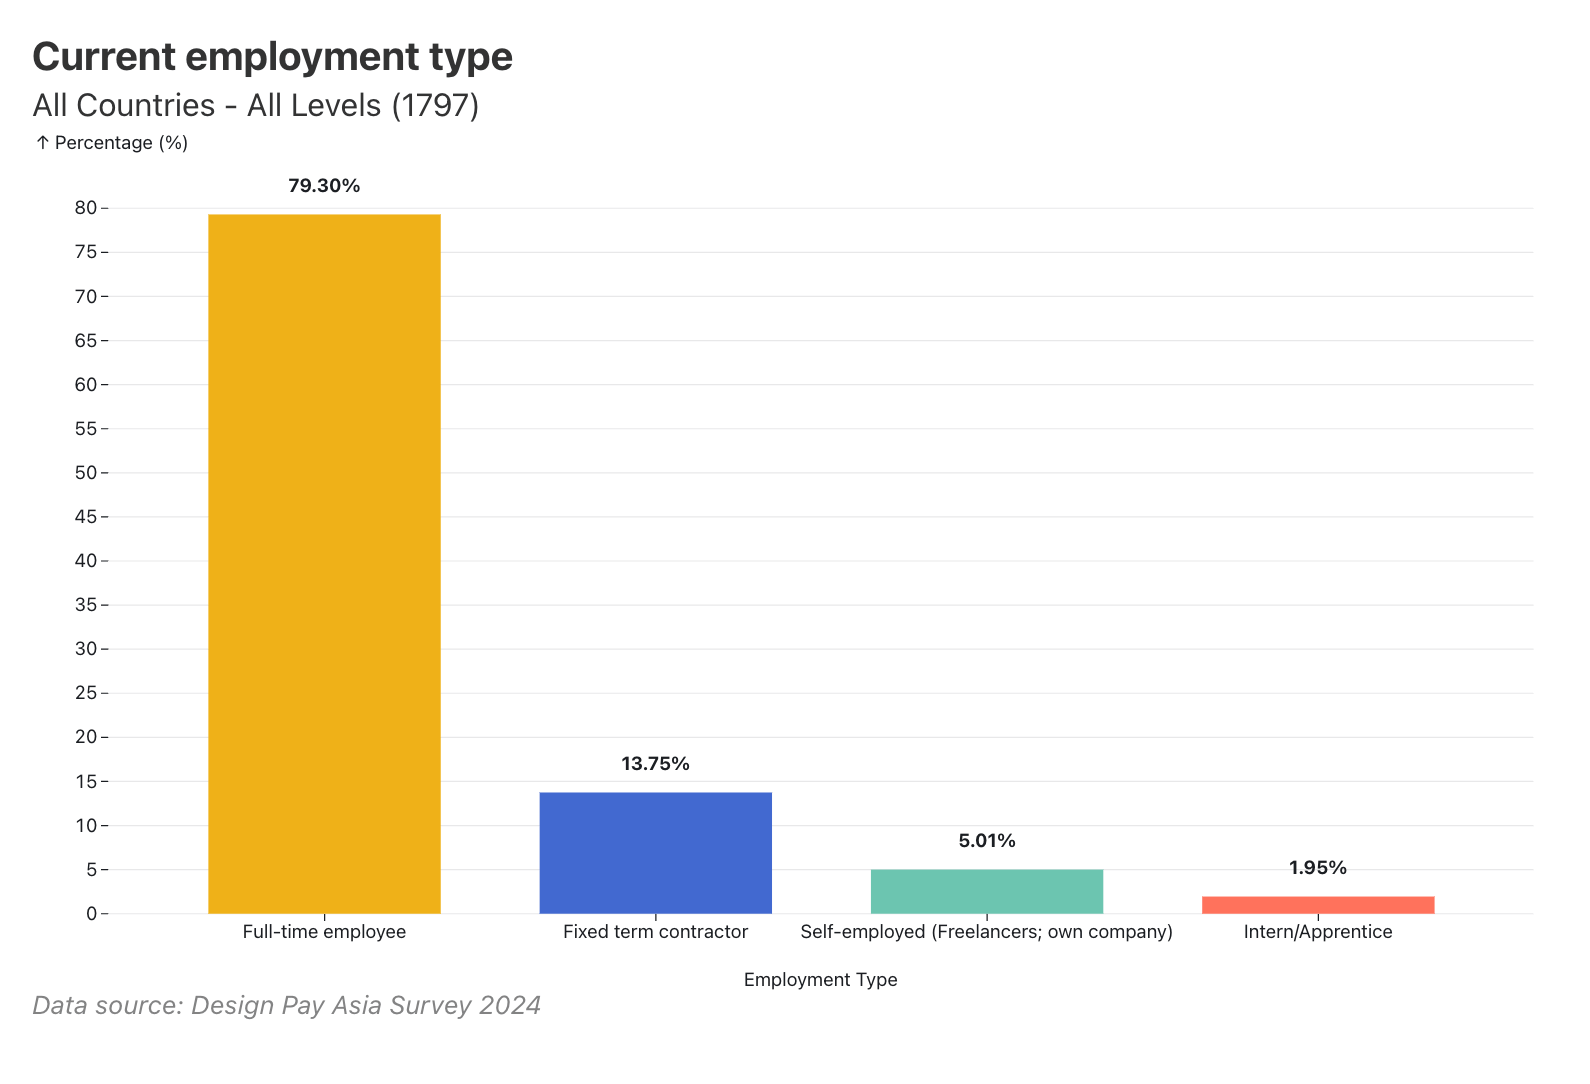
Current employment type
Breakdown of employment arrangements across all designers surveyed.
79.3% of designers are in full-time employment; contractors and freelancers combine for 18.76%.
View data table
| Employment type | Respondents (n) | Proportion |
|---|---|---|
| Full-time | 1,425 | 79.3% |
| Fixed-term contractor | 247 | 13.75% |
| Self-employed/Freelancer | 90 | 5.01% |
| Intern/Apprentice | 35 | 1.95% |
Chart proof
Career level distribution
Career level distribution comparing regional and Singapore profiles.
Mid-level ICs at 42.6% regional vs 32.2% Singapore. Leadership at 5.9% regional vs 11.5% Singapore.
View data table
| Level | Respondents (n) | Share |
|---|---|---|
| Junior | 382 | 21.0% |
| Mid | 765 | 42.6% |
| Senior | 369 | 21.0% |
| Leadership | 106 | 5.9% |
| SG Senior+ | 20 | 11.5% |
Chart proof
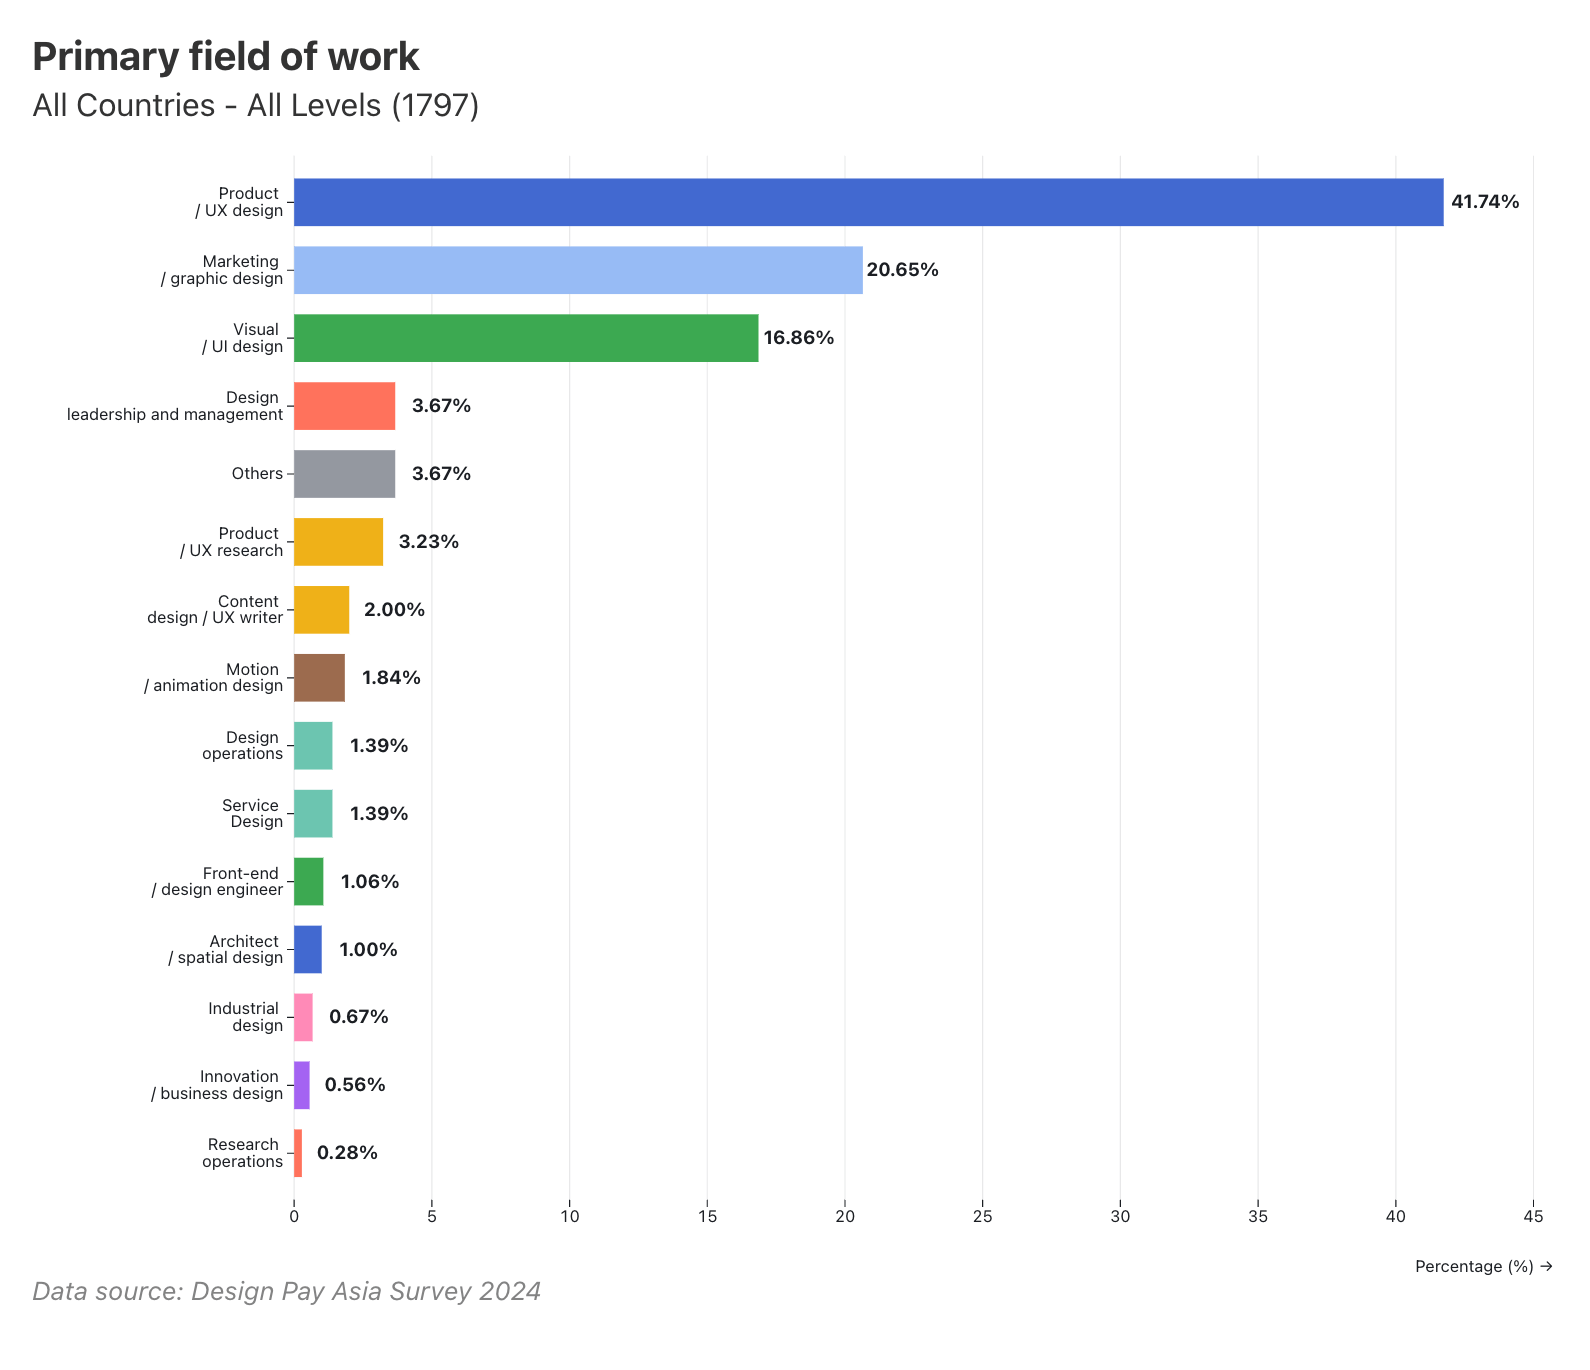
Primary field of work
Distribution of primary design specialisation across all respondents. Based on N=1,797 responses.
Digital design accounts for 61.83% (led by Product/UX at 41.74%), while traditional design makes up 22.65% and emerging specialities 8.67%.
View data table
| Specialisation | Proportion |
|---|---|
| Product/UX design | 41.74% |
| Visual/UI design | 16.86% |
| Marketing/Graphic design | 20.65% |
| Design leadership | 3.67% |
| Other emerging | ~5% |
Chart proof
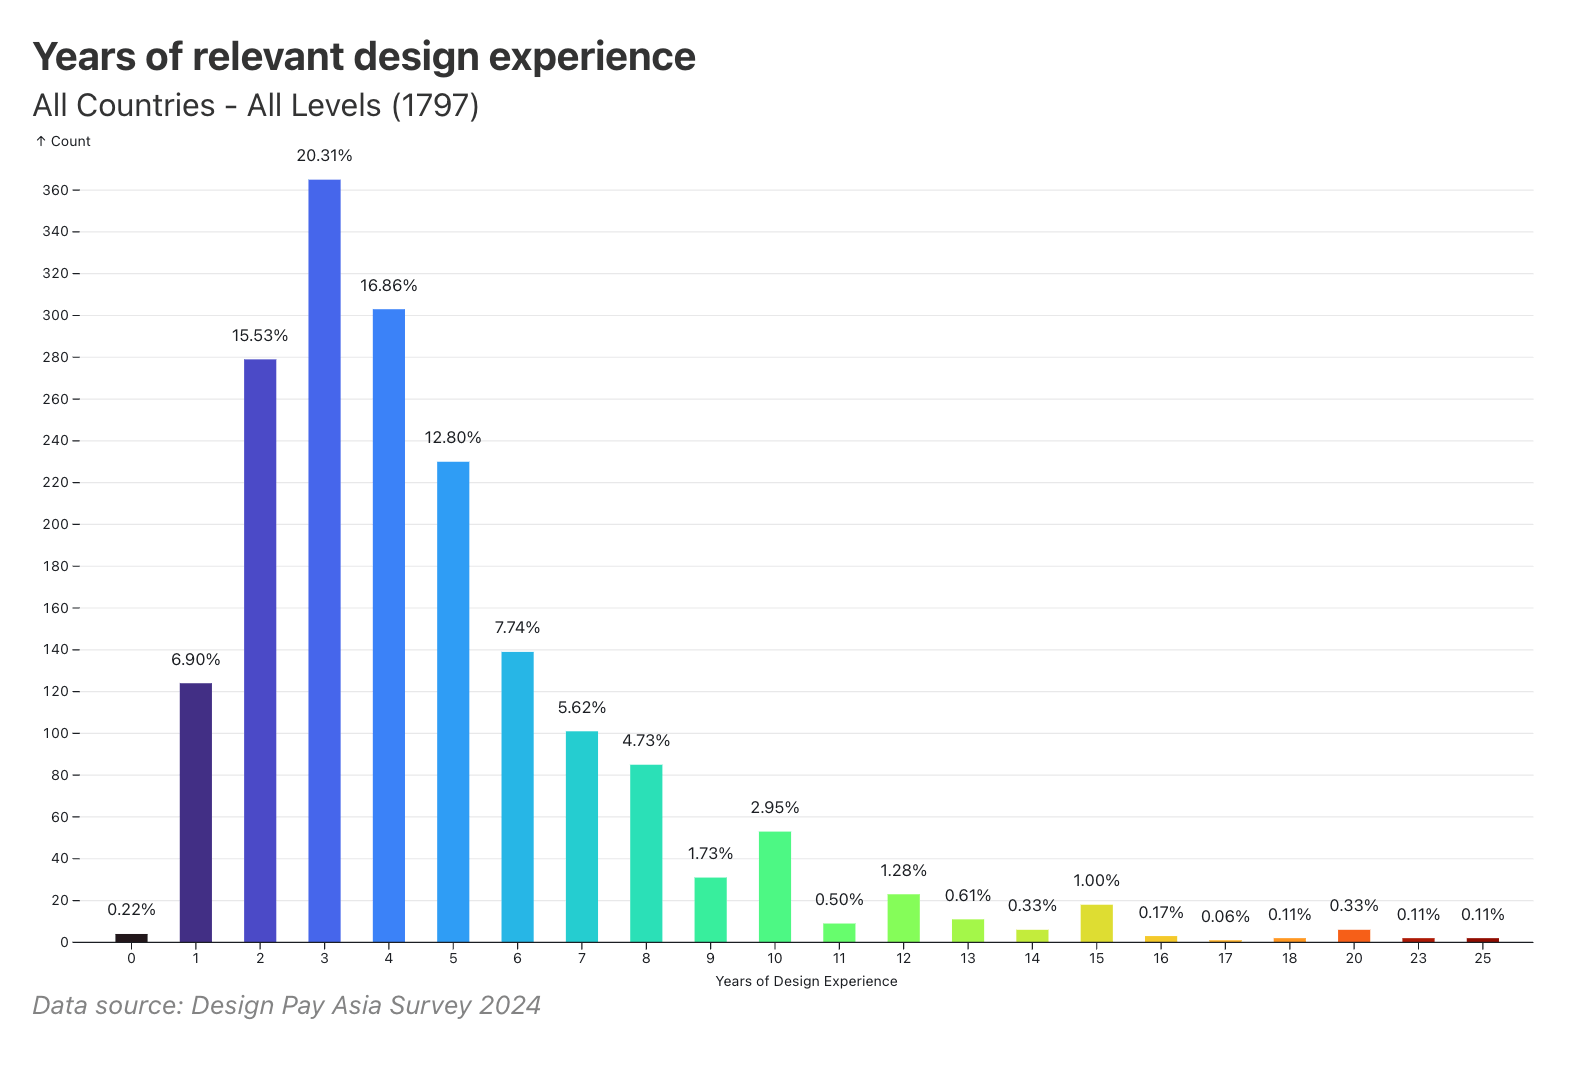
Years of relevant design experience
Distribution of design-specific years of experience across all respondents. Based on N=1,797 responses.
Peak concentration is at 3 years (20.31%), with more than 60% having 1–5 years of design experience; senior designers (10+ years) account for 7.95%.
View data table
| Experience band | Proportion |
|---|---|
| 1–5 years | >60% |
| 6–10 years (mid-career) | 12.74% |
| 10+ years (senior) | 7.95% |
| 20+ years (veteran) | 1.62% |
A young field: most of us are five years in or less.
Chart proof
Years of total working experience
Distribution of total working years (across all industries) for all respondents. Based on N=1,797 responses.
Early-career respondents (2–5 years total) are the largest group at 37.37%, but 17.20% have 20+ years of total work experience.
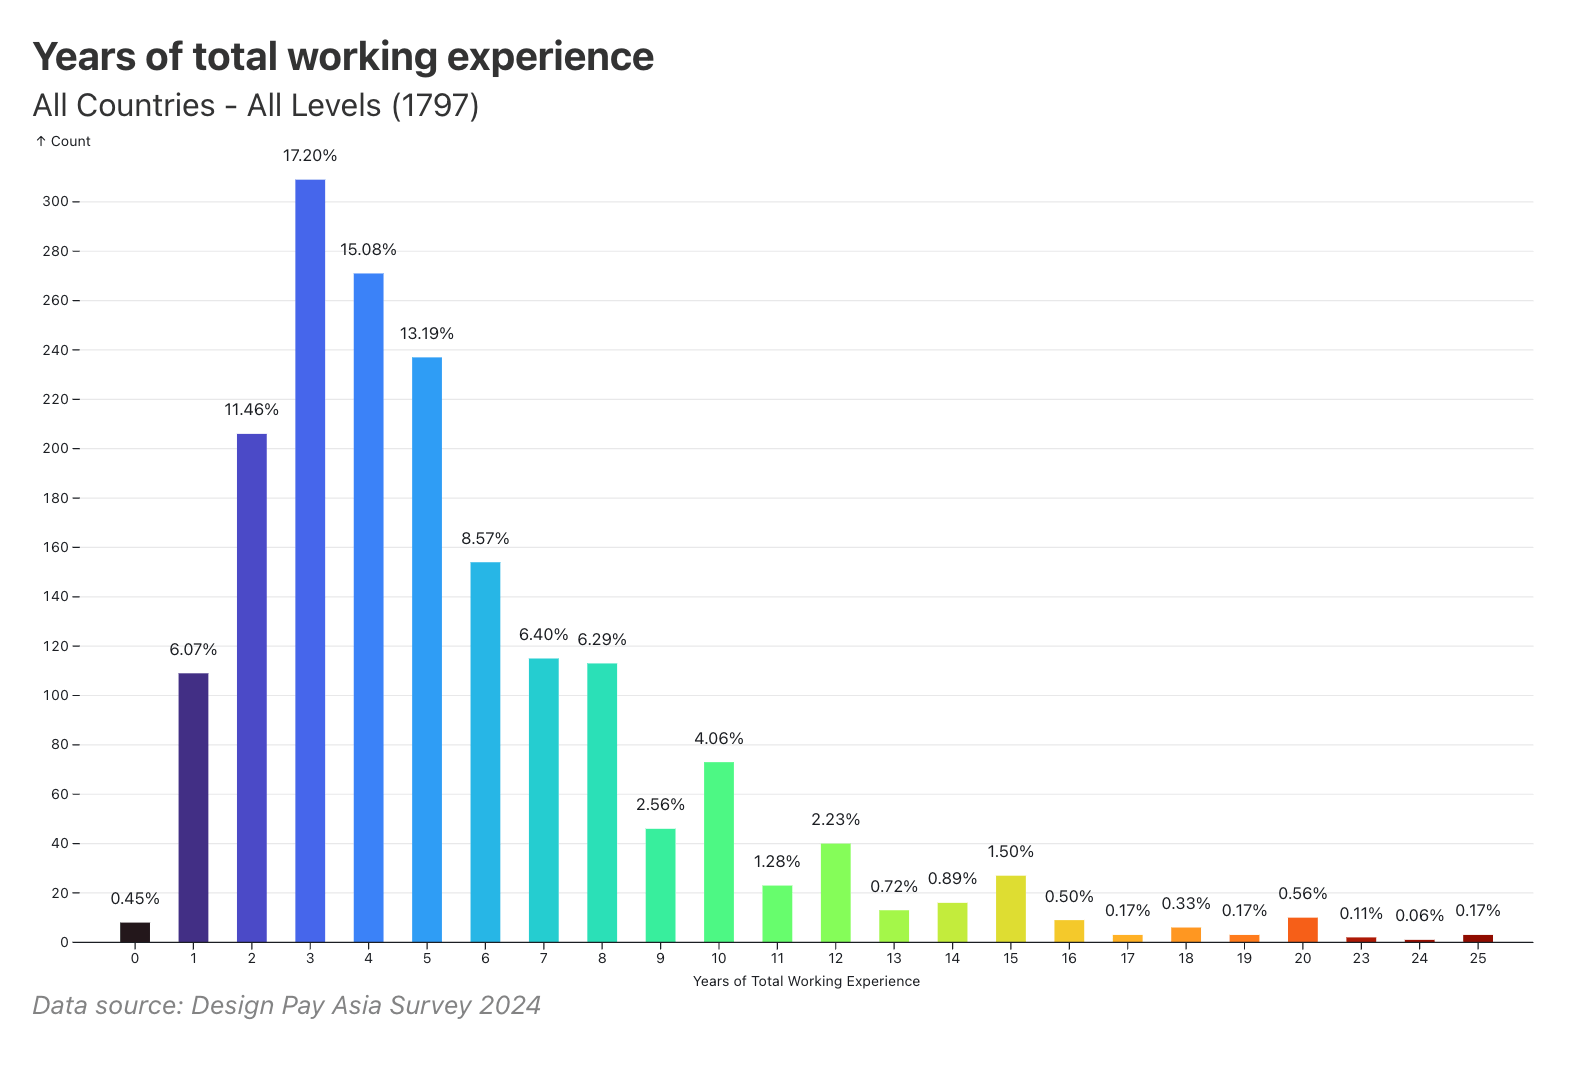
View data table
| Experience band | Proportion |
|---|---|
| 0–1 years | 6.52% |
| 2–5 years | 37.37% |
| 6–10 years | 19.37% |
| 11–20 years | 19.54% |
| 20+ years | 17.20% |
Chart proof
Total working vs design years of experience
Scatter or bubble chart correlating total working experience with design-specific experience.
68% of respondents have total experience within 2 years of their design experience, indicating design as their primary career; notable outliers have 20+ total years but fewer than 10 in design.
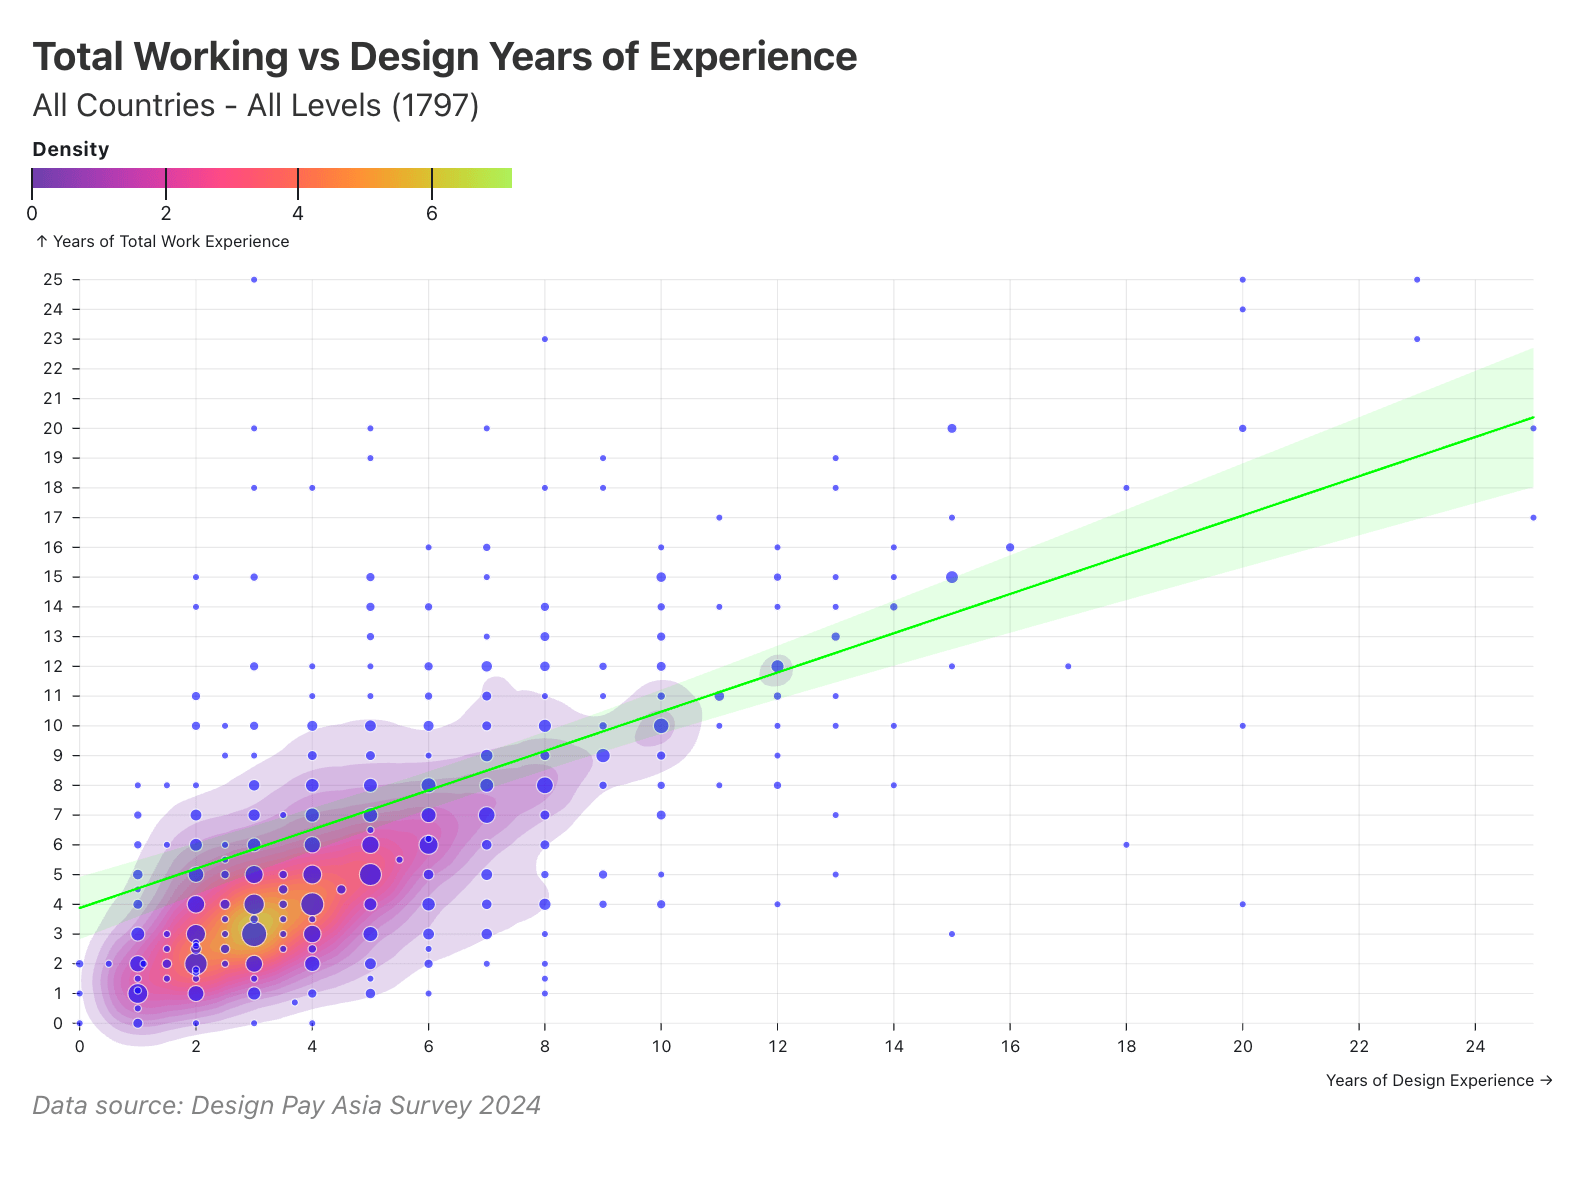
View data table
| Pattern | Value |
|---|---|
| Within 2 years of design exp | 68% |
| Largest cluster (total/design) | 3–7 years each |
Chart proof
Highest level of formal education attained
Education level distribution across all respondents.
77.46% hold a bachelor's degree; master's degrees account for 5.23% and diplomas for 8.40%.
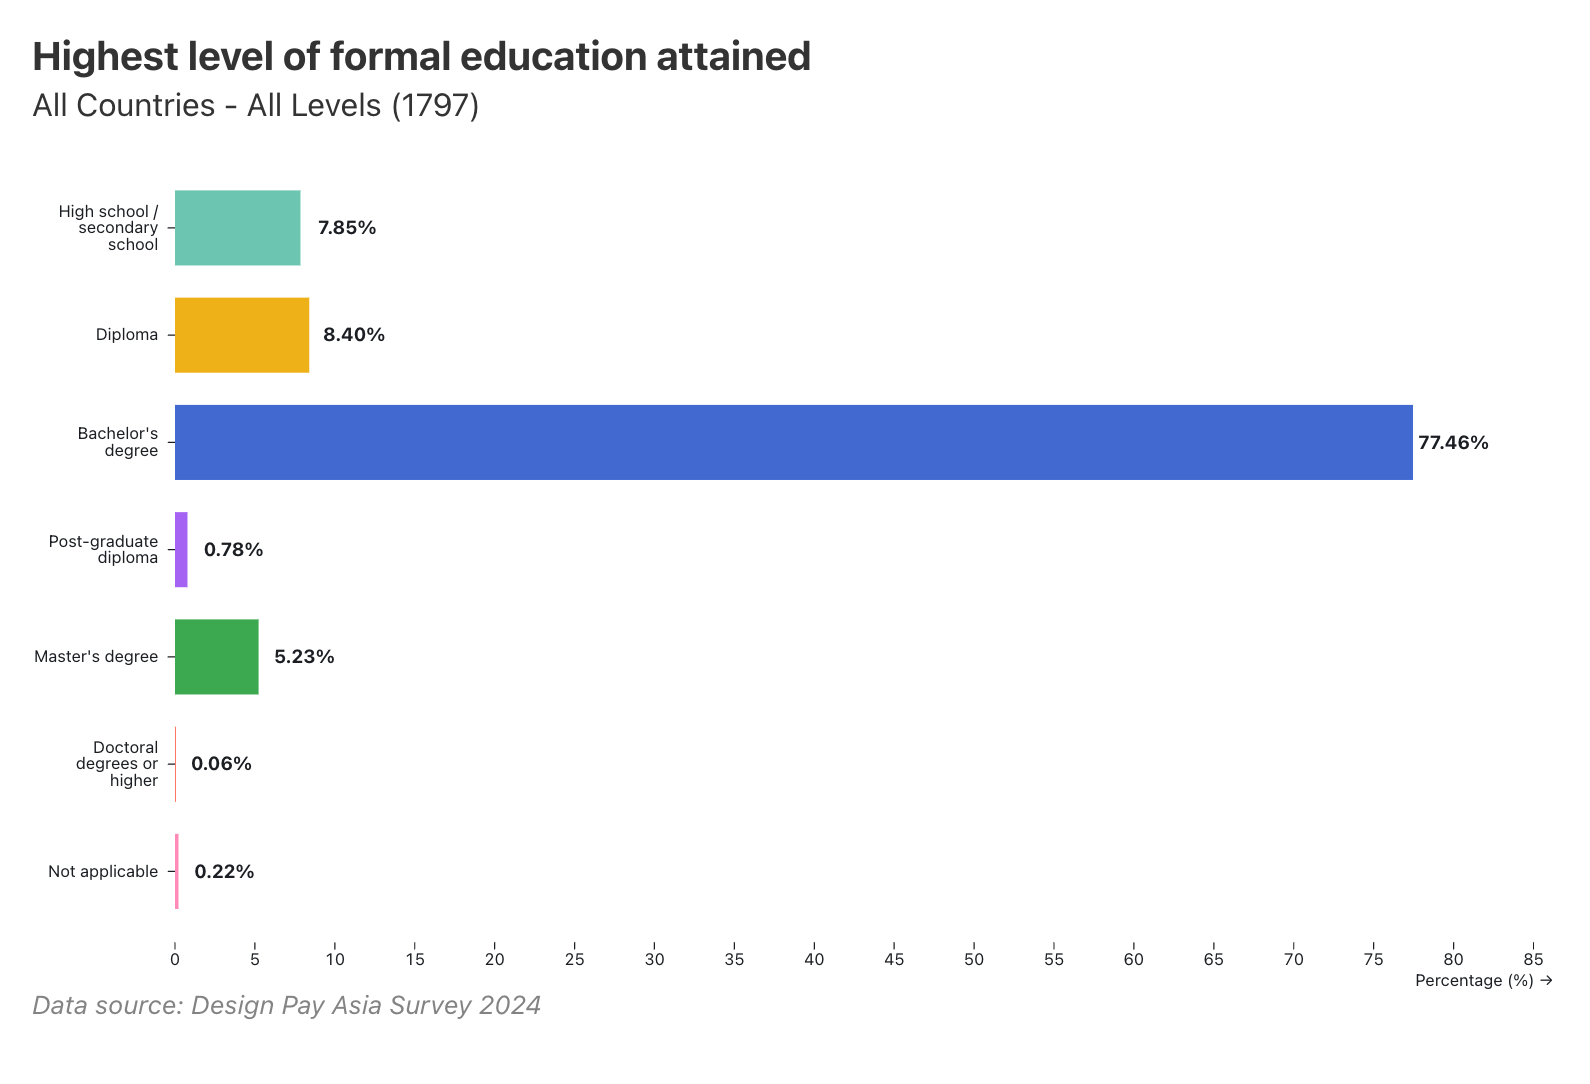
View data table
| Education level | Respondents (n) | Proportion |
|---|---|---|
| Bachelor's degree | 1,392 | 77.46% |
| Diploma | 151 | 8.40% |
| Master's degree | 94 | 5.23% |
| High school/Secondary | 141 | 7.85% |
Chart proof
Design-related education (formal or informal)
Whether respondents have any design-related educational background.
65.33% of designers have some design-related education, while 34.67% have no formal design training.
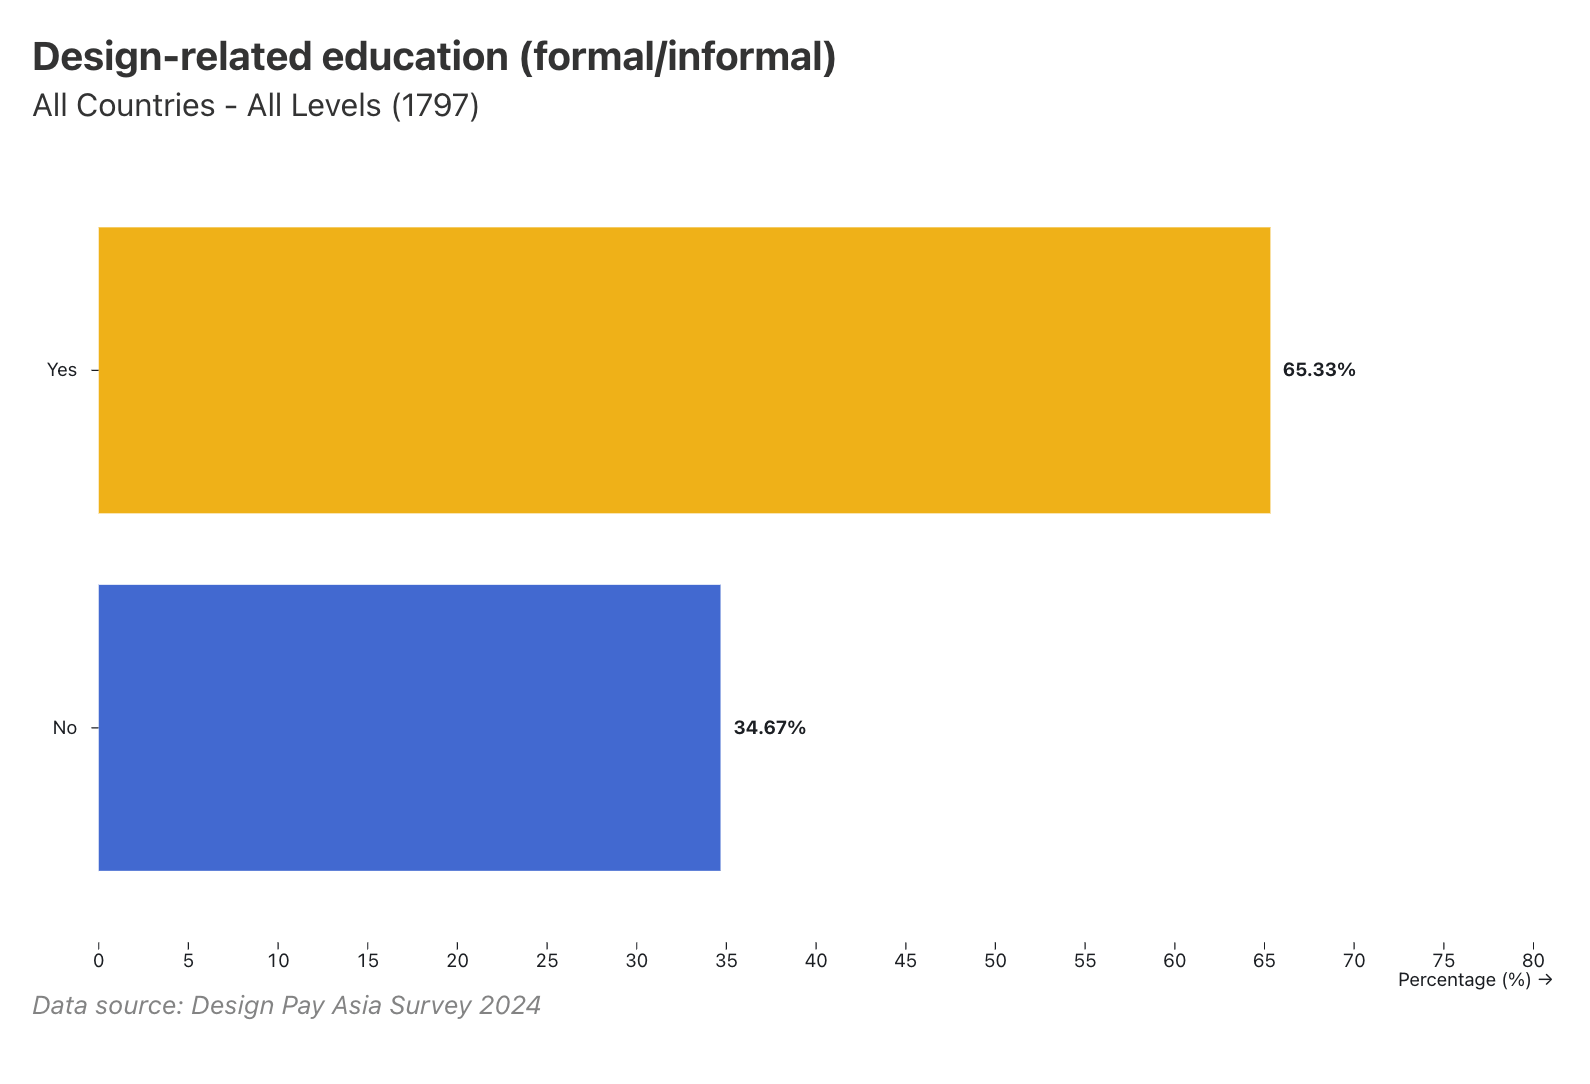
View data table
| Education status | Respondents (n) | Proportion |
|---|---|---|
| Has design-related education | 1,174 | 65.33% |
| No formal design training | 623 | 34.67% |
Chart proof
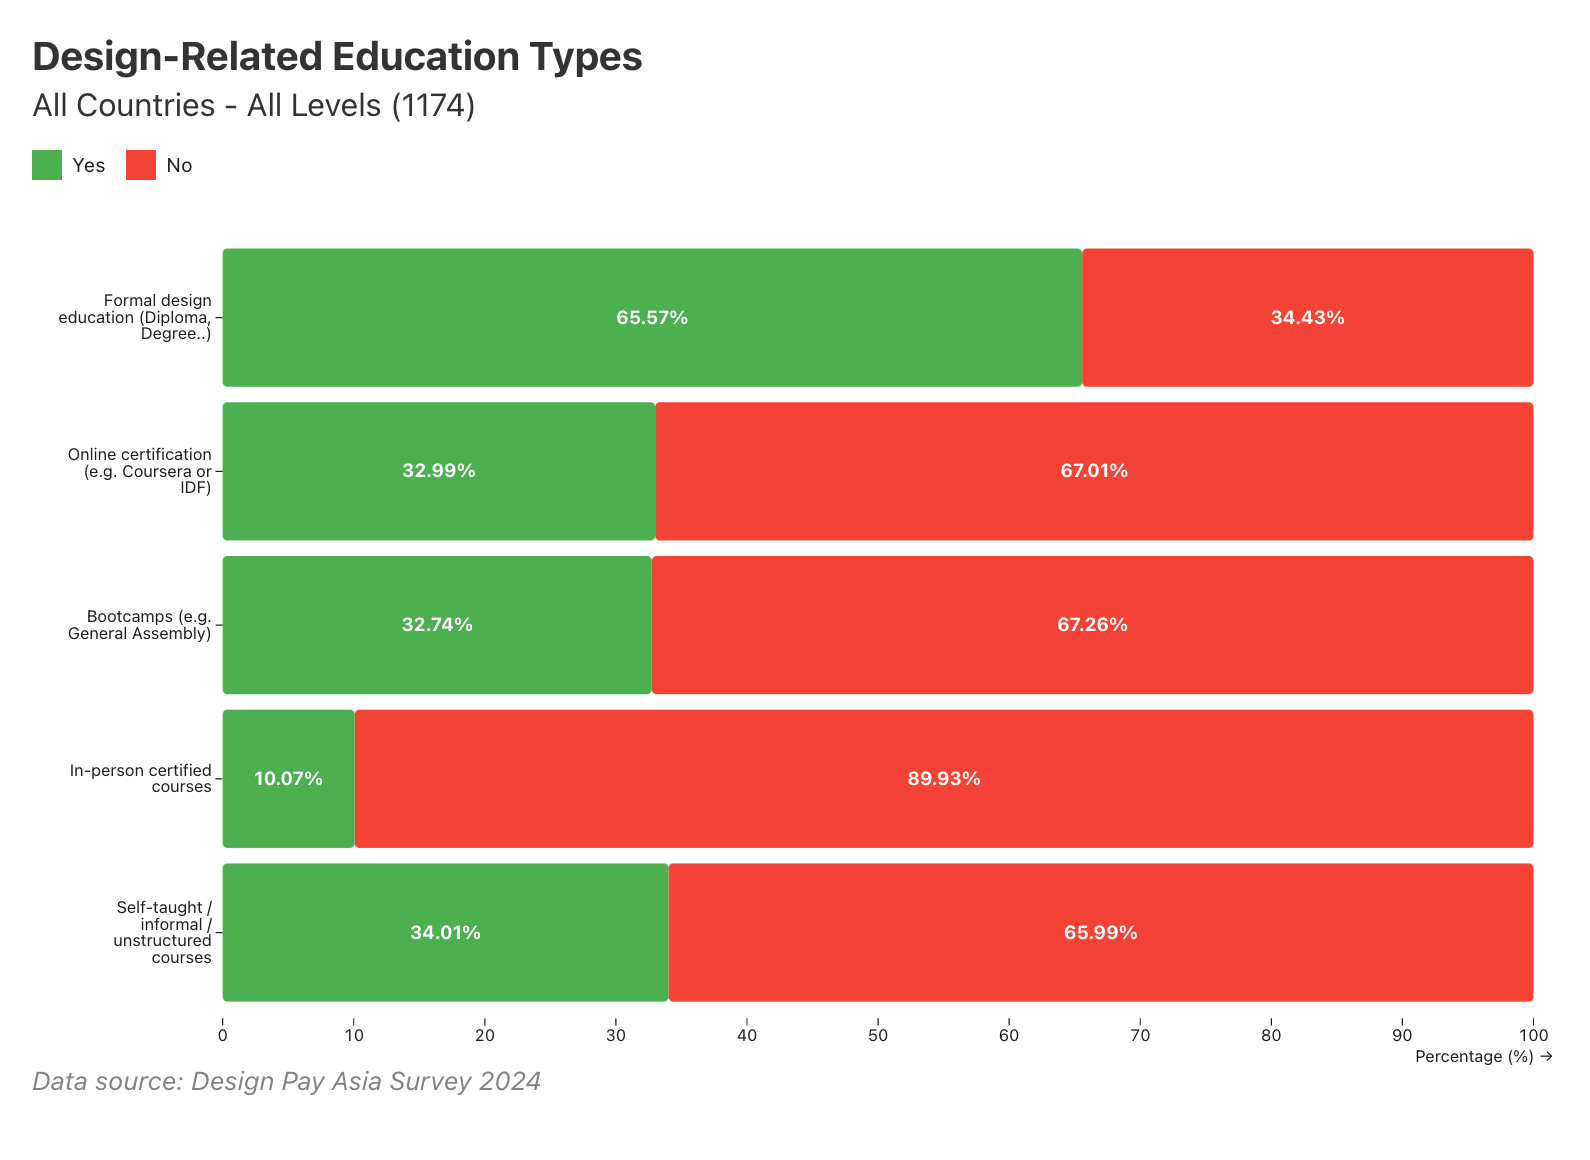
Design-related education types
Distribution of design learning formats among those with design education.
Formal academic education leads at 65.57%, but self-taught/informal courses reach 34.01% and online certifications 32.99%, reflecting a highly mixed learning ecosystem.
View data table
| Education type | Respondents (n) | Proportion |
|---|---|---|
| Formal academic | 775 | 65.57% |
| Self-taught/Informal | 402 | 34.01% |
| Online certifications | 390 | 32.99% |
| Bootcamps/Workshops | 387 | 32.74% |
| In-person certified courses | 119 | 10.07% |
Chart proof
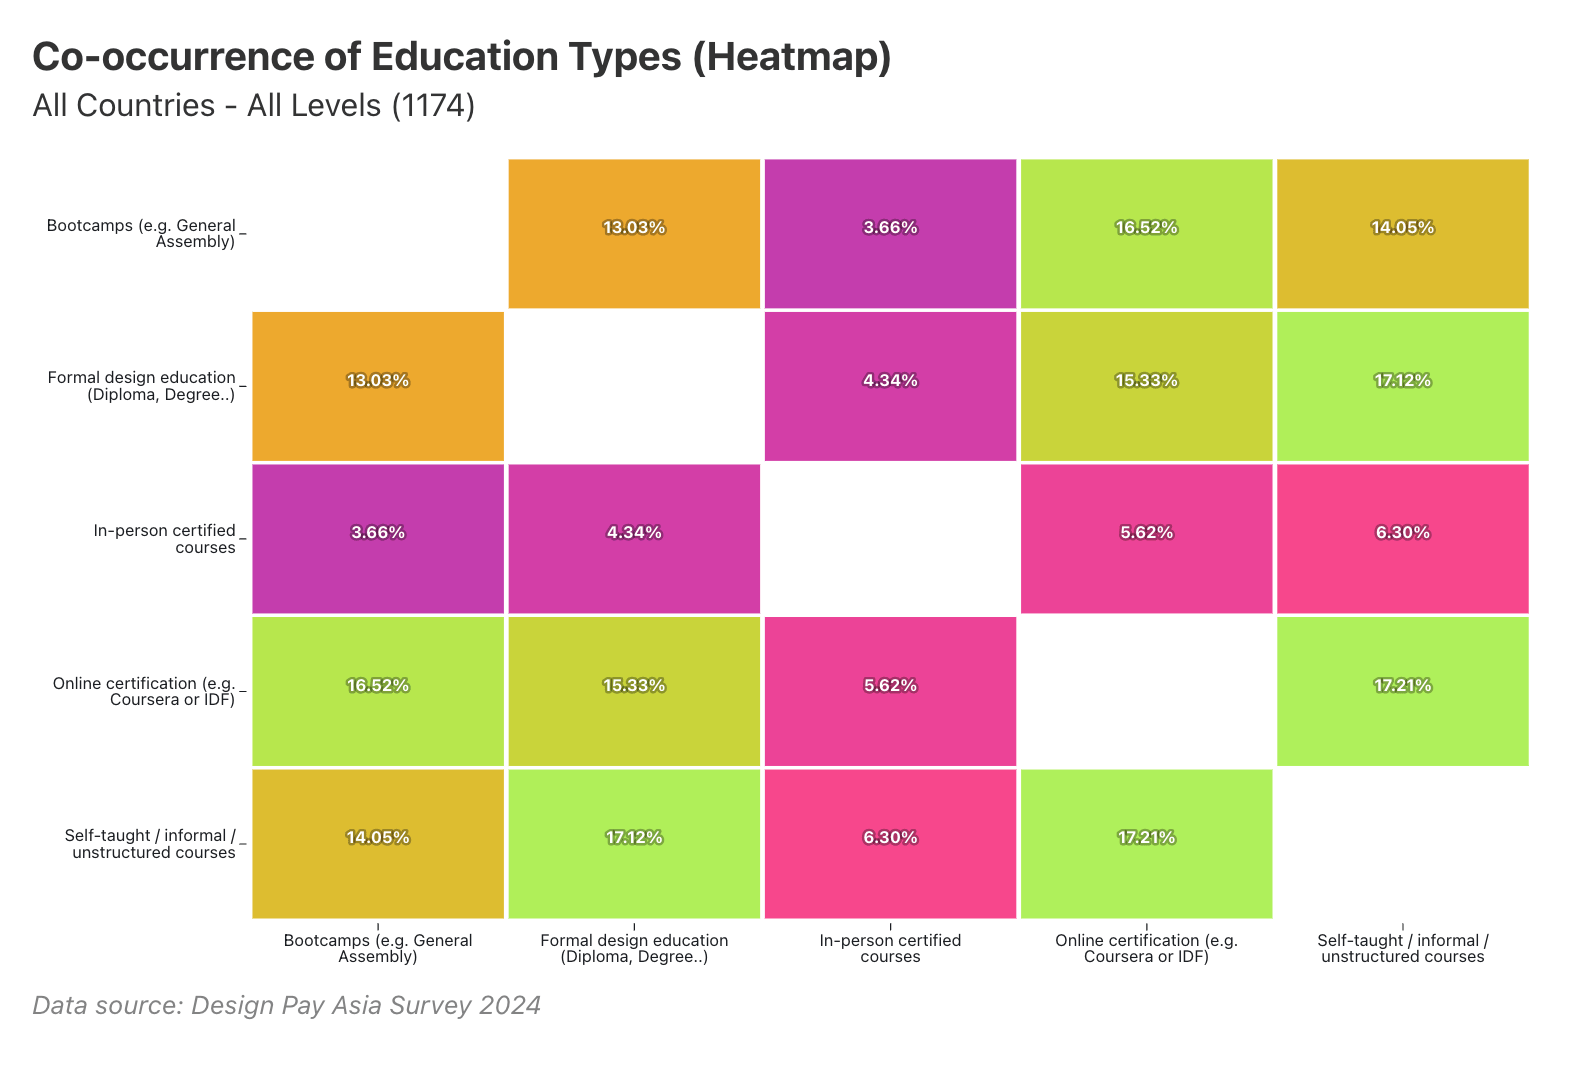
Co-occurrence of education types (heatmap)
Heatmap showing how designers combine different learning formats.
Self-taught with online certification (17.21%) and formal education with self-taught (17.12%) are the most common learning combinations.
View data table
| Combination | Respondents (n) | Co-occurrence |
|---|---|---|
| Self-taught + Online certification | 202 | 17.21% |
| Formal + Self-taught | 201 | 17.12% |
| Bootcamps + Online certification | 194 | 16.52% |
| Formal + Online certification | 180 | 15.33% |
Chart proof
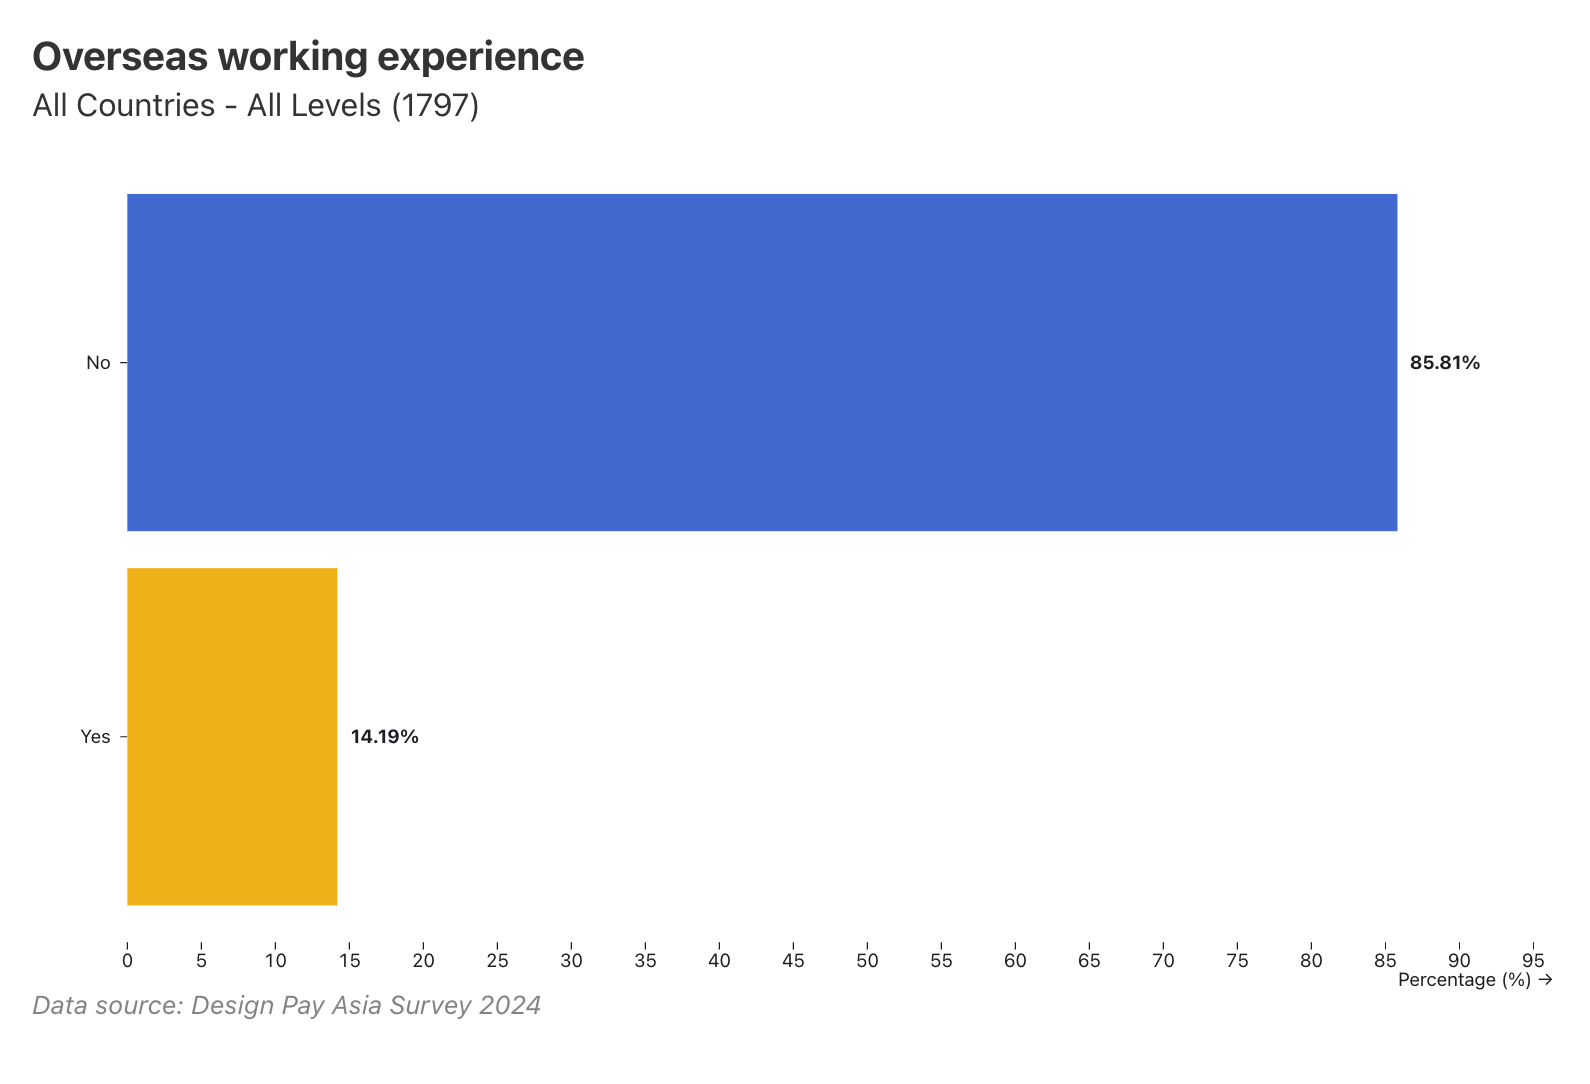
Overseas working experience
Share of designers with international versus domestic career experience.
85.81% of designers have exclusively domestic careers; 14.19% have international work experience.
View data table
| Career scope | Respondents (n) | Proportion |
|---|---|---|
| Domestic career | 1,542 | 85.81% |
| International experience | 255 | 14.19% |
Mid-level individual contributors form the largest career cohort in the region, and Singapore shows a markedly higher concentration of senior and leadership roles than the rest of the sample. Whether that reflects a market of more established employers or something else in how Singapore respondents were reached, the survey cannot say.
Formal design education is common across the region, though how designers get there varies enough to raise real questions about accessibility for career-switchers and the self-taught.
What this means for you
If you're a designer
- Consider how your previous experience in other fields could make you stand out.
- Look for skills beyond design that could help you advance (like business or technology).
If you're leading a team or organisation
- Think about how your company views and supports design leadership.
- Be ready to show how design adds value to your business, especially when budgets are tight.
- Check if you are helping individual designers become managers and the potential value it could bring.
- Compare how you develop design leaders versus other departments like tech.
Evidence and further reading
Evidence used in this section
-
Design roles dominated by digital and product design with mid-level experience
Digital design accounts for 61.8% of roles, with Product/UX at 41.7%. Mid-level ICs form the largest group at 42.6%, while leadership roles are limited at 5.9%. Formal design education reported by 77.5%, with 14.19% having international exposure.
-
Singapore roles: higher Product/UX concentration, more senior distribution
Singapore employment is more formalised with 87.4% full-time (vs 79.3% regional), 9.8% contract, and only 1.7% freelance. Career levels: Mid-level IC 32.2% (vs 42.6% regional), Senior IC 25.9% (vs 20.5%), Leadership 11.5% combined (vs 5.9%). Primary fields: Product/UX 69.5% (significantly above regional), Marketing 6.9%, Visual/UI 6.3%. Design leadership at 5.2% (vs 3.7% regional).
Further reading and context
- Designer-to-developer ratio: NN Group study
- Digital design job openings projected to increase by 8% from 2023 to 2033
- Design is the most popular university subject, but only 25% of graduates become designers
- Southeast Asian companies with D&I programs are 2.5x more likely to benefit diverse employees
- Only 1 in 3 companies have an equal design leader at the top
Questions worth exploring
Why aren't we seeing more design leaders in our region?
Worth exploring next
- How important are university degrees in different companies and countries?
- How will budget cuts affect developing future design leaders and career pathways?
Where this sits in the conversation
-
Overview
2024 report -
Landscape
Demographics -
Landscape
Roles & experiences you are here -
Landscape
Compensation -
Landscape
Company landscape -
Sentiments
Offer & negotiation -
Sentiments
Career progression -
Sentiments
Value of design -
Sentiments
Job market -
Singapore deep dive
Singapore deep dive -
Close
The conversation continues
Commentary
In understanding where design teams stand today, we find that for every design manager there are 16 individual designers. This might suggest we need more design leaders.